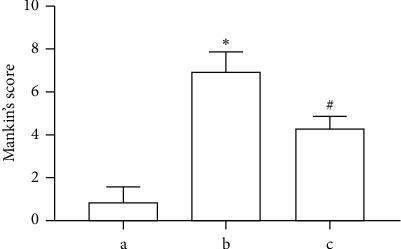
Figure 3.

Mankin's scoring was based on the hematoxylin-eosin (HE) staining results. (a) Blank control group; (b) OA model group (established with the Hulth method); (c) TFRD-treated group (treated with total flavonoids of Rhizoma Drynariae (TFRD) after model induction with the Hulth method. The data are expressed as the mean ± standard deviation (∗p < 0.01 compared with Group a; #p < 0.01 compared with Group b).
