
Figure 2.
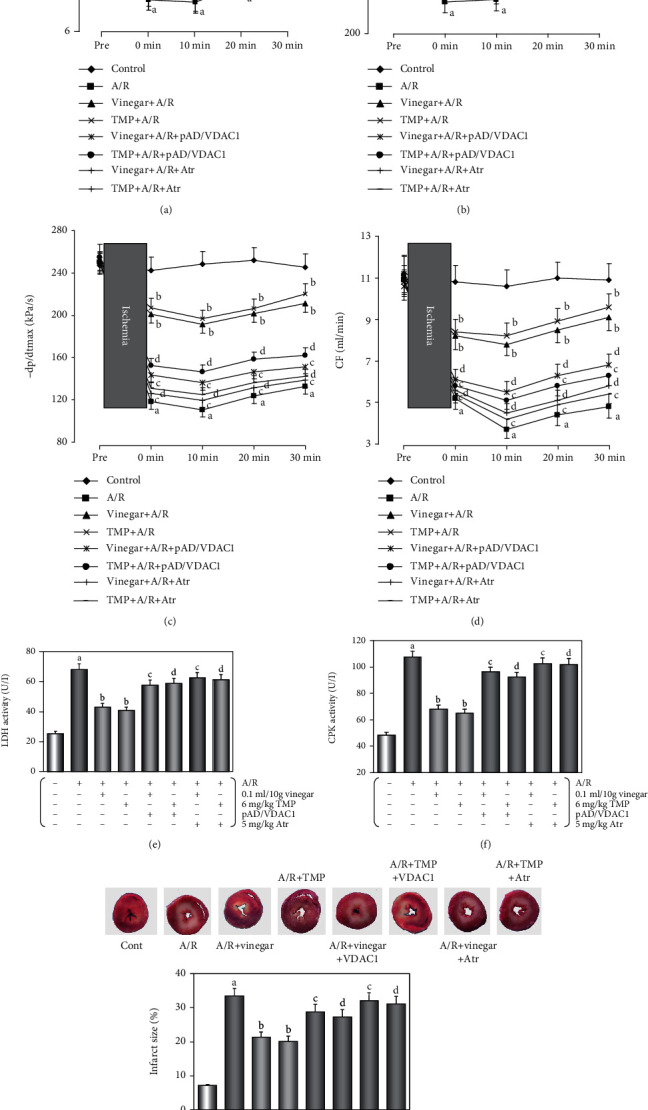
Effects of the hemodynamic parameters, LDH and CPK activities, and the myocardial infarct size by vinegar/TMP pretreatment on isolated mouse heart against A/R injury. (a) Histogram of LVDP. (b, c) Histogram of ±dp/dt max. (d) Histogram of CF. (e, f) Histogram of activities of LDH and CPK. Data were expressed as the mean ± SEM (n = 10). (g) Histogram of myocardial infarct size. Data were expressed as the mean ± SEM (n = 5). (a) P < 0.01 vs. the control group. (b) P < 0.01 vs. the A/R group. (c) P < 0.01 vs. the vinegar+A/R group. (d) P < 0.01 vs. the TMP+A/R group.