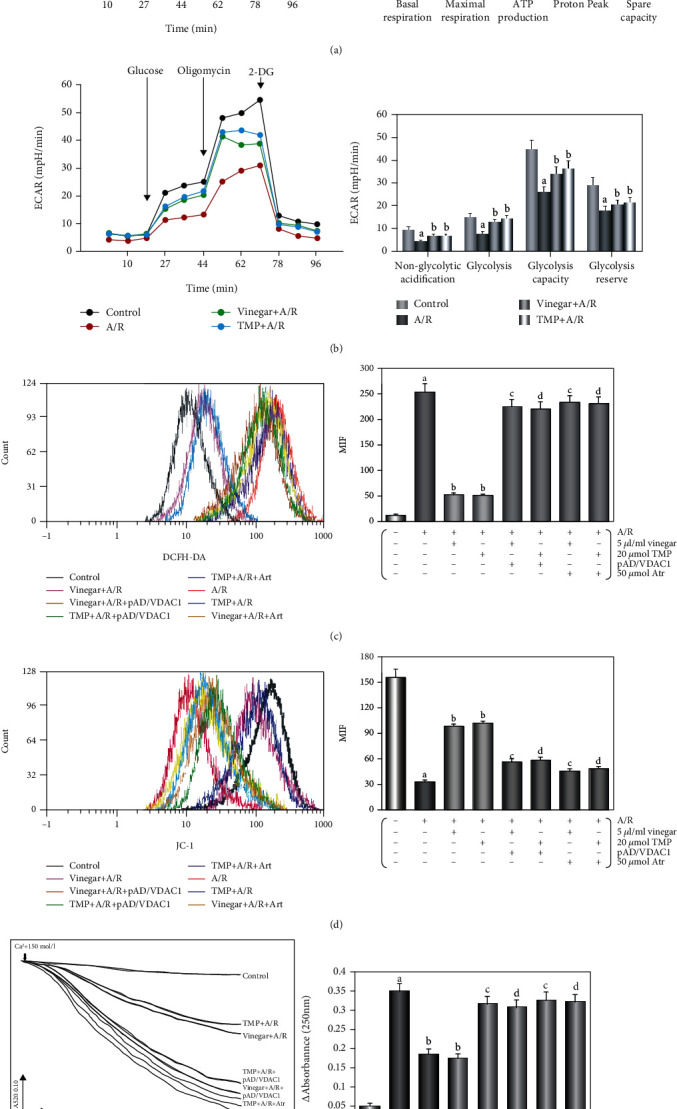
Figure 5.

Effects of vinegar/TMP on alleviating mitochondrial dysfunction in cardiomyocyte against A/R injury. (a) Mitochondrial OCR curves and histogram of the important parameter. (b) Mitochondrial ECAR curves and histogram of the important parameter. Data were expressed as the mean ± SEM (n = 3). (c) Histogram of ROS generation. (d) Histogram of MMP levels. (e) Histogram of mPTP opening. Data were expressed as the mean ± SEM (n = 8). (a) P < 0.01 vs. the control group. (b) P < 0.01 vs. the A/R group. (c) P < 0.01 vs. the vinegar+A/R group. (d) P < 0.01 vs. the TMP+A/R group.
