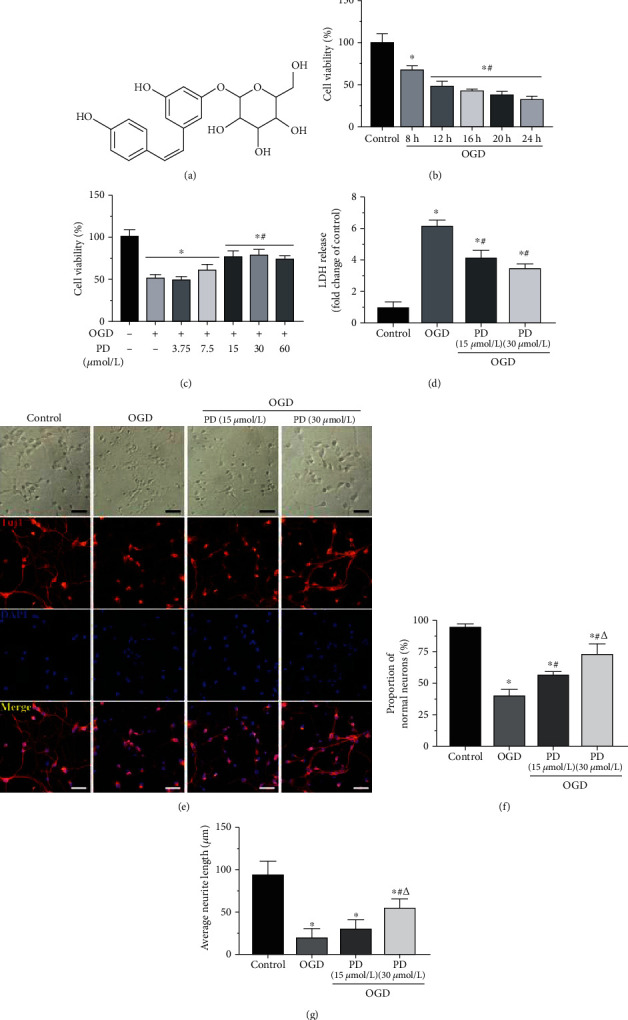
Figure 1.

Effects of PD on the viability and morphology of SMNs exposed to OGD/R. (a) The structure of PD. (b) Percentage of viable SMNs exposed to OGD/R conditions for varying durations (8-24 h). (c) Percentage of viable SMNs with/out PD (3.75, 7.5, 15, 30, or 60 μM) treatment during hypoxic injury. (d) Extracellular LDH levels in the indicated groups. (e) Representative images showing the morphology changes in the primary neurons of indicated group and the (f) number of normal neurons and (g) average neurite length. Scale bars = 50 μm. ∗P < 0.05 vs. Control; #P < 0.05 vs. OGD; ΔP < 0.05 vs. OGD + PD (15 μM).
