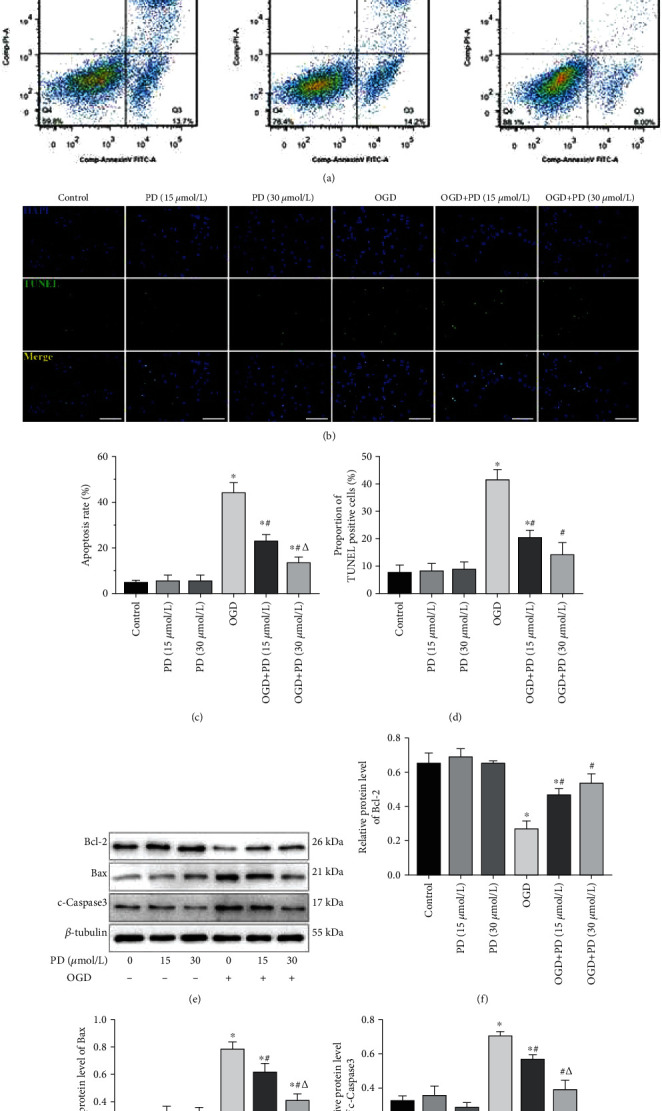
Figure 3.

PD attenuates OGD/R-induced damage in SMNs. Cells were divided into the Control, PD (15 μM), PD (30 μM), OGD/R, OGD/R + PD (15 μM), and OGD/R + PD (30 μM) groups. (a) Representative images showing Annexin V-FITC/PI stained cells. (b) Representative images showing TUNEL-positive cells. Scale bars = 100 μm. Quantification of the apoptotic cells in (c) Annexin V-FITC/PI and (d) TUNEL assays. (e) Immunoblot showing Bcl-2, Bax, and c-Caspase-3 protein levels in the neurons of the indicated groups. (f–h) Quantification of the relative protein levels. ∗P < 0.05 vs. Control; #P < 0.05 vs. OGD; ΔP < 0.05 vs. OGD + PD (15 μM).
