Figure 4.

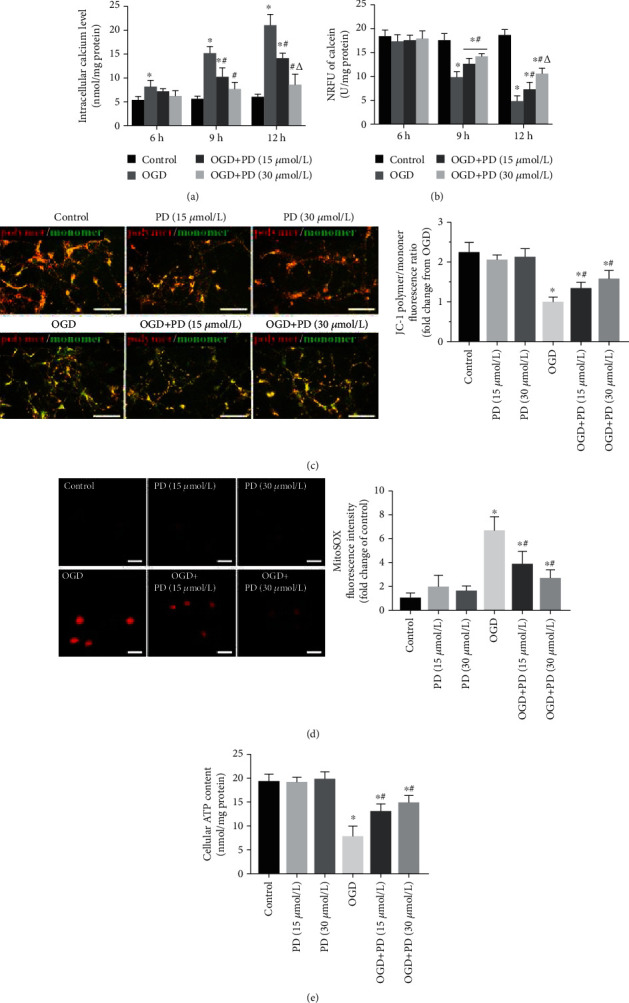
PD restores mitochondrial functions in OGD/R-injured neurons. (a) [Ca2+]i levels in cells exposed to normoxia or hypoxia-reperfusion in the indicated groups. (b) Normalized relative fluorescence units (NRFU) of calcein indicating mPTP opening in the differentially treated cells. (c) The ratios of polymeric (red) and monomeric (green) forms of JC-1 corresponding to the MMP in the indicated groups. Scale bars = 100 μm. (d) MitoSOX fluorescence intensity indicative of ROS levels. Data are presented as fold change over the Control group. Scale bars = 10 μm. (e) Neuronal ATP release (nmol/mg protein) as measured by a luciferase-based assay. ∗P < 0.05 vs. Control; #P < 0.05 vs. OGD; ΔP < 0.05 vs. OGD + PD (15 μM).
