Figure 6.

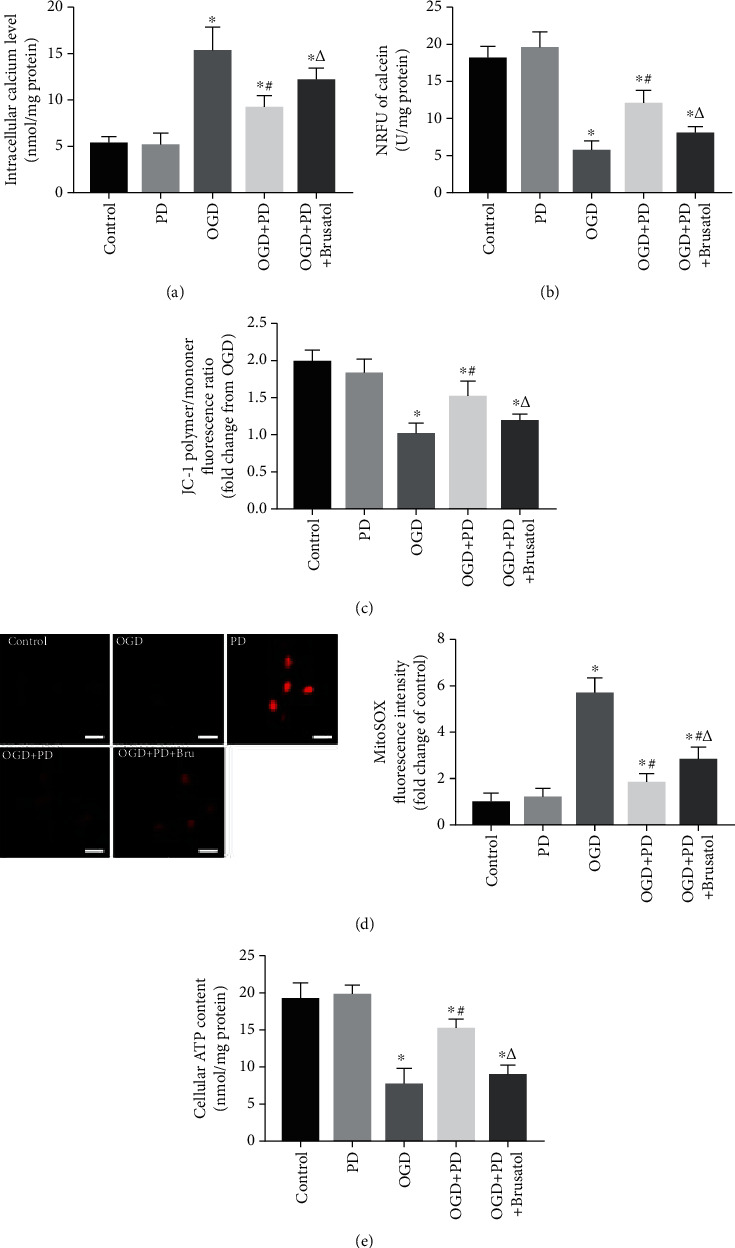
PD-mediated mito-protective depends on the Nrf2/ARE pathway. (a) [Ca2+]i levels in cells exposed to normoxia or hypoxia-reperfusion in the indicated groups. (b) NRFU of calcein indicating mPTP opening in the differentially treated cells. (c) The ratios of polymeric (red) and monomeric (green) forms of JC-1 corresponding to the MMP in the indicated groups. (d) MitoSOX fluorescence intensity indicative of ROS levels. Data are presented as fold change over the Control group. Scale bars = 10 μm. (e) Neuronal ATP release (nmol/mg protein) as measured by a luciferase-based assay. ∗P < 0.05 vs. Control; #P < 0.05 vs. OGD; ΔP < 0.05 vs. OGD + PD.
