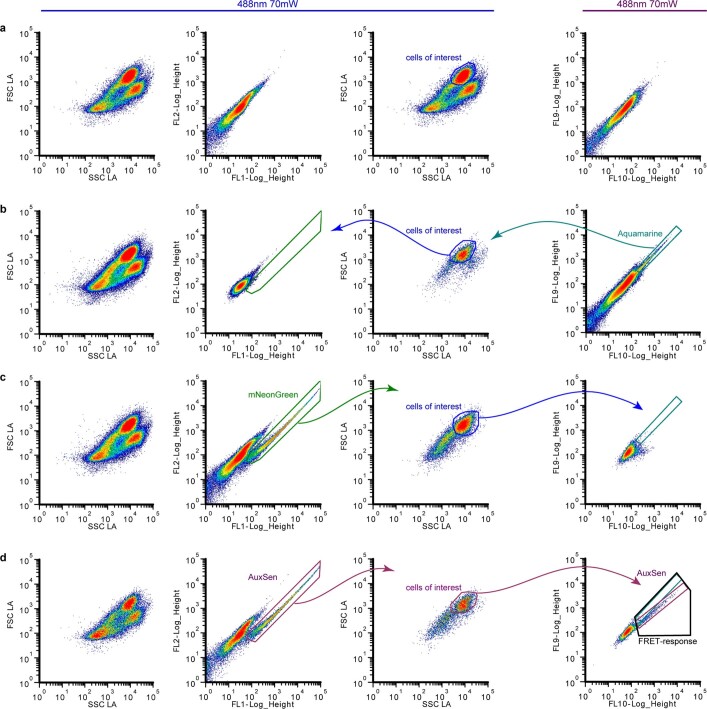
Extended Data Fig. 7. Demonstration of relevant population regions and Aquamarine, mNeonGreen and AuxSen fluorescent emission in cell-suspension-culture protoplasts.
Bivariate plots from left to right are as follows: forward versus side-scatter log area ungated; emission peak to shoulder FL1 (534/30) versus FL2 (585/29); forward versus side-scatter log area with cells of interest marked and gated for b–d; emission peak-to-shoulder FL9 (465/30) versus FL10 (529/28). Arrows indicate ‘gating’, meaning that the following plot is restricted to those data points that fall within that particular window. a, Cells only transfected with water. b, Cells transfected with pJIT60-2xp35SS:NLS:Aquamarine. Cells expressing Aquamarine were used to determine which scattering population produced the fluorescent protein. This gate is followed for mNeonGreen emission. c, Cells transfected with pJIT60-2xp35SS:NLS:mNeonGreen. Cells expressing mNeonGreen were used to determine which scattering population produced the fluorescent protein. This gate is followed for Aquamarine emission. d, Cells transfected with pJIT60-2xp35SS:NLS:AuxSen. Cells expressing AuxSen identified by their mNeonGreen emission then restricted to the ‘cells of interest’ scattering population that produced the greatest amount of protein. The FRET-response region was then made to encompass the entire range of possible fluorescence, including the shift in the FL9 to the FL10 bandpasses. See also Supplementary Table 2. Flow cytometry basic gate statistics and FRET-ratios based on (‘FL10-Log_Height’/‘FL9-Log_Height’) ratio are plotted against time for the final gate FRET response.

