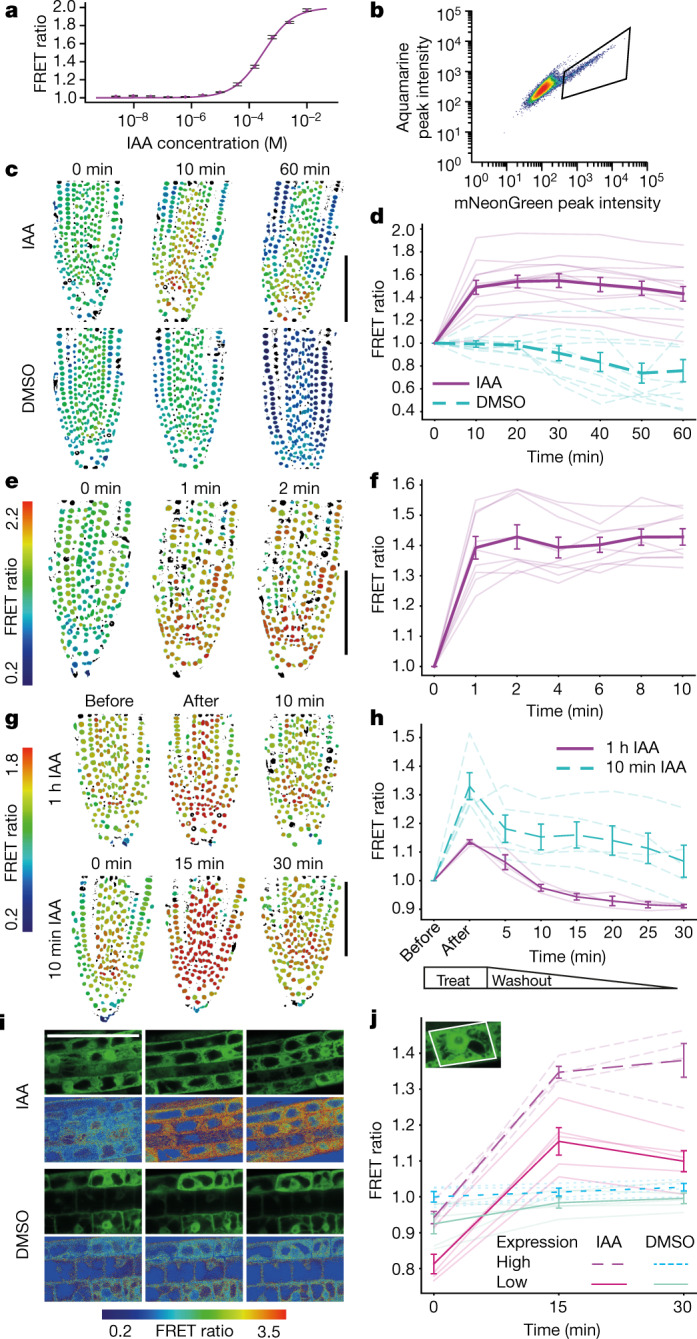
Fig. 3. FRET ratio of AuxSen in response to auxin treatment.

a, b, The FRET ratio obtained by flow cytometry in Arabidopsis protoplasts. a, Dose–response curve, normalized to the minimum FRET ratio (mean ± s.e.m.; n = 3 biologically independent samples). b, Baseline fluorescence intensity (‘Log_Height’ (a.u.)) without exogenous IAA; the relevant area is boxed (Extended Data Figs. 6,7). c–f, Changes in the FRET ratio (colour bar) in root nuclei incubated in 10 μM IAA recorded for 1 h (c, d) or for 10 min (e, f). c, e, Images (DMSO, control). Scale bar, 100 μm. d, f, Quantitative analyses. The thick lines represent the mean (±s.e.m.), and the thin lines each represent independent single-seedling measurements (n = 14 (experimental), n = 10 (control) in d, n = 9 in f). g, h, Changes in the FRET ratio (colour bar) in root nuclei following the washout of IAA. g, Images obtained after incubation with 10 μM IAA for 1 h (top) or 10 min (bottom). Images were taken before or immediately after IAA treatment, or 10 min after the end of IAA treatment. Scale bar, 100 μm. h, Quantitative analysis. The thick lines represent the mean (±s.e.m.), and the thin lines each represent independent single-seedling measurements (n = 5 (10 min), n = 3 (1 h)). i, j, Change in the FRET ratio of ER-localized AuxSen in response to 100 μM IAA. i, Expression of ER-localized AuxSen (green; first and third rows) and FRET ratio (colour bar; second and fourth rows) of root tissue treated with IAA (top two rows) or DMSO (bottom two rows; control). Scale bar, 50 μm. j, Quantitative analysis of cells with high (broken lines; IAA, n = 4; DMSO, n = 4) or low (solid lines; IAA, n = 5; DMSO, n = 5) levels of AuxSen accumulation. The thick lines represent the mean (±s.d.), the thin lines each represent individual cells. Inset, AuxSen expression in the ER.
