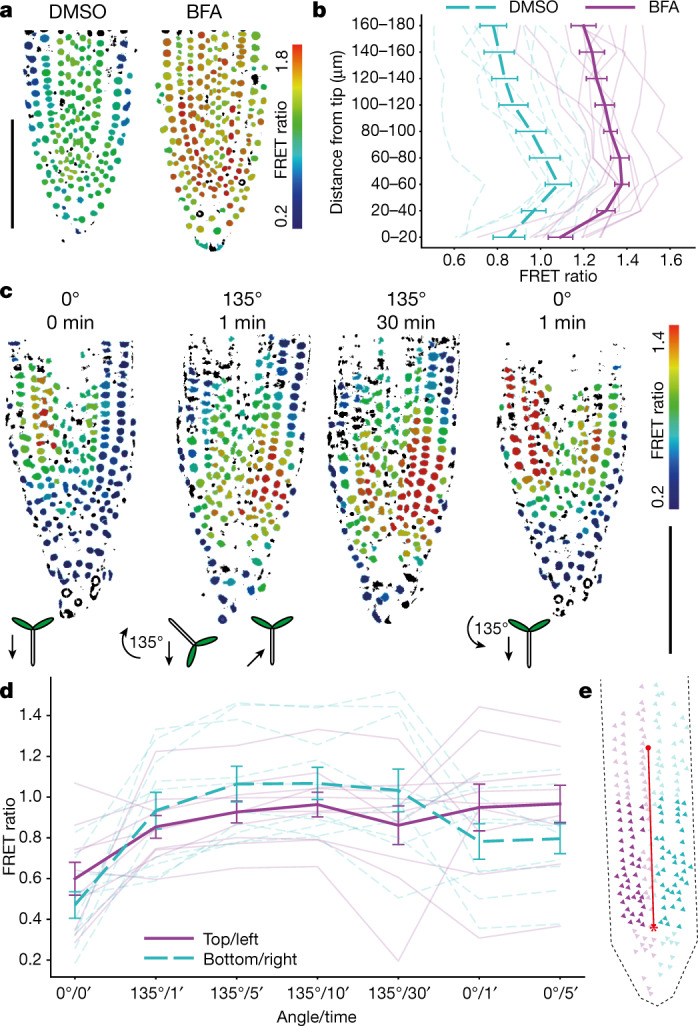
Fig. 4. FRET ratio of auxin sensor in response to redistribution of endogenous auxin.

a, b, Change in the nuclear FRET ratio (colour bar) within the root tip of individual seedlings treated with brefeldin A (BFA) or DMSO. a, Images. b, Quantitative analysis after treatment with BFA (10 μM for 10 h, magenta; n = 10) or DMSO (control, green; n = 9). The thick lines represent the mean (±s.e.m.), the thin lines each represent individual seedlings. c, d, The response of AuxSen to root gravitropism. c, Top, nuclear FRET ratio (colour bar) before and after turning (first and second images), and before and after turning back to the near-vertical position (third and fourth images). Bottom, Cartoons of the seedlings, with arrows indicating the direction of the gravity vector. The signal moves from the left side to the bottom and back to the left side; the colour scale indicates the relative FRET ratio. d, Quantified response of the sensor in individual roots. The thick lines represent the mean (±s.e.m.), the thin lines each represent individual roots (n = 10). Scale bars, 100 μm (a, c). e, Diagram of root tip. Nuclei within 100 μm above the quiescent centre (asterisk) and at least 10 μm from the midline (red line) were analysed (dark triangles). Green, right/bottom; magenta, left/top.
