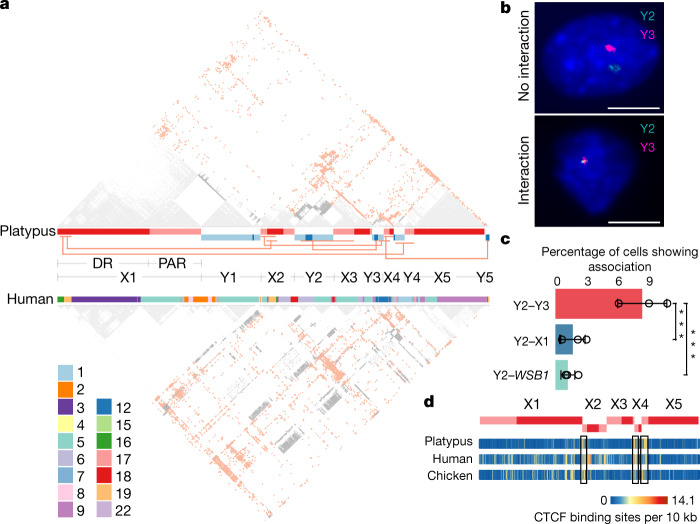
Fig. 3. Interactions between the platypus sex chromosomes.
a, Interchromosomal interactions among the platypus sex chromosomes detected by Hi-C data of liver tissue in platypus (top) and human (bottom). The bars between the Hi-C panels show the platypus sex chromosomes and their orthologues in the human genome. Grey, intrachromosomal interactions; red, interchromosomal interactions. Red lines link the regions with significantly high interchromosomal interactions. The interchromosomal interactions seem to be conserved in mammals, as indicated by the homologous chromosomal fragments of the human and platypus sex chromosomes and their Hi-C contact patterns. b, FISH with BAC probes to detect sex chromosomes Y2, Y3 or X1 and autosome chromosome17 (WSB1) in interphase platypus fibroblasts. Examples show no interaction between chromosomes Y2 and Y3 (top, n = 593, 3 independent experiments) and interaction (bottom, n = 56, 3 independent experiments). Scale bars, 10 μm. c, The significantly higher frequency of interaction between Y2 and Y3 than that between Y2 and X1, and between Y2 and WSB1 (chromosome 17). n = 185, 206, 258 cells for the three independent replicate experiments of Y2–Y3, n = 258, 250, 205 cells for the three independent replicate experiments of Y2–X1, n = 298, 262, 220 cells for the three independent replicate experiments of Y2–WSB1. Data are mean ± s.d. ***P < 0.001 (Y2–Y3 versus Y2–X1, P = 0.0004675; Y2–Y3 versus Y2–WSB1, P = 6.376 × 10⁻⁵), one-sided Fisher’s exact test. d, Putative CTCF-binding-site density plot showing its enrichment among homologous regions in the platypus, human and chicken genomes.

