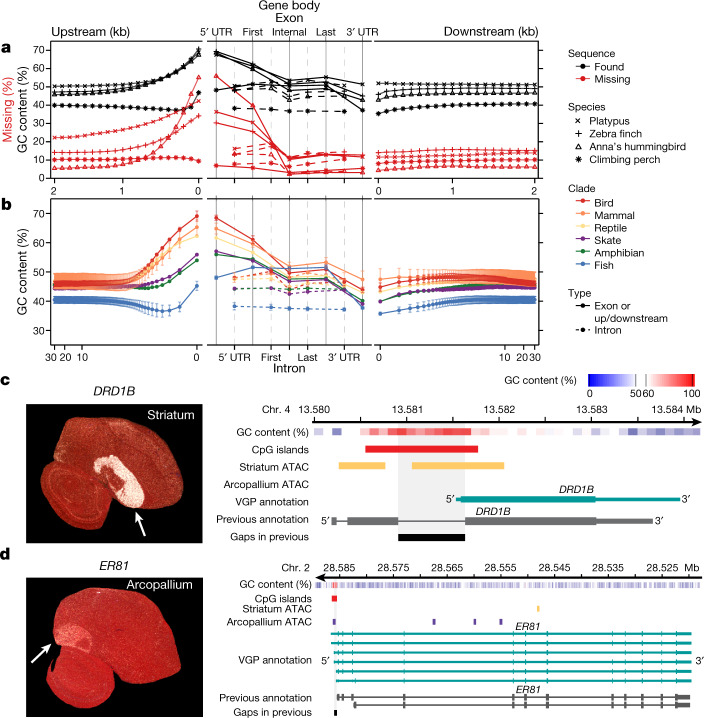
Fig. 4. VGP assemblies reveal GC content patterns in protein-coding genes.
a, Average GC content (n = 14,000–18,000 annotated coding genes; Extended Data Table 2) in VGP assemblies (black) and the percentage of genes with missing sequence in the earlier references (red) based on a Cactus alignment, in 100-bp blocks, 2 kb on either side of all protein-coding genes (left and right), and for UTRs, exons, and introns (middle). b, Average GC content (mean ± s.d. for lineages with more than one species) of the six major vertebrate lineages sequenced, for 30 kb upstream and downstream (in 100-bp blocks, log scale; left and right) and of the UTR, exons, and introns (middle). c, d, Left, specialized expression (arrows) shown by in situ hybridization of DRD1B in the zebra finch striatum (c) and ER81 in the arcopallium (d), from Jarvis et al.47; the cerebellum was removed from the ER81 image. Right, ATAC–seq profiles in the GC-rich promoter regions of these genes, showing each gene’s GC content (red is high), the ATAC–seq peaks in striatum (purple) or arcopallium (yellow) neurons, and portions of missing sequence (black) in the previous reference assembly (grey).

