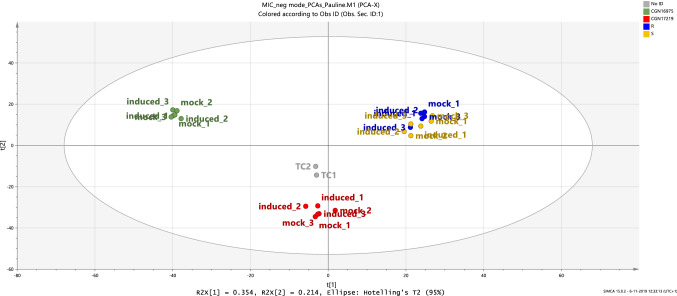
Fig. 4.
Principal components analysis (PCA) plot of the thrips-exposed and mock-treated Capsicum leaf samples based on their metabolite profiles determined by untargeted LCMS. Green dots correspond to the resistant (CGN16975A) reference samples, red dots to the susceptible (CGN17219A) reference samples, blue dots to the samples from group R and yellow dots to the samples from group S. TC1 and TC2 correspond to the technical quality control samples. Each sample is a pool of 10 leaves from 5 individual plants. The explained variance is 56.8%

