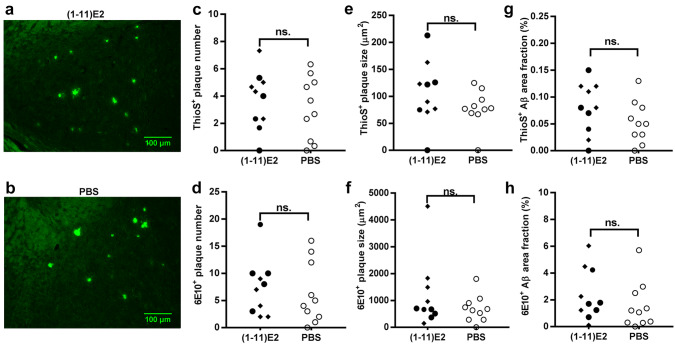
Fig. 2.
(1–11)E2 vaccination did not reduce Aβ plaques number and size and the area fraction occupied by plaques. Representative thioflavin S histochemistry in the hippocampus of 13-month-old 3xTg mice immunized with (1–11)E2 (a) or PBS (b). Dot plots show the number (c), plaque size (e), and area fraction (g) of thioflavin S+ amyloid plaques in 3xTg mice immunized with (1-11)E2 (black symbols) or PBS (white symbols). Each dot represents one mouse. Quantification of 6E10+ amyloid plaques number (d), plaque size, (f) and Aβ area fraction (h) in 3xTg mice (n = 10) immunized with (1–11)E2 (black) or PBS (white). Each dot represents one mouse. In the (1–11)E2 group, diamonds indicate high responders (anti-Aβ titer at day 300 above 1:10,000) and circles indicate low responders (titer below 1:10,000). No statistically significant difference was observed between (1–11)E2 vaccinated mice and PBS controls

