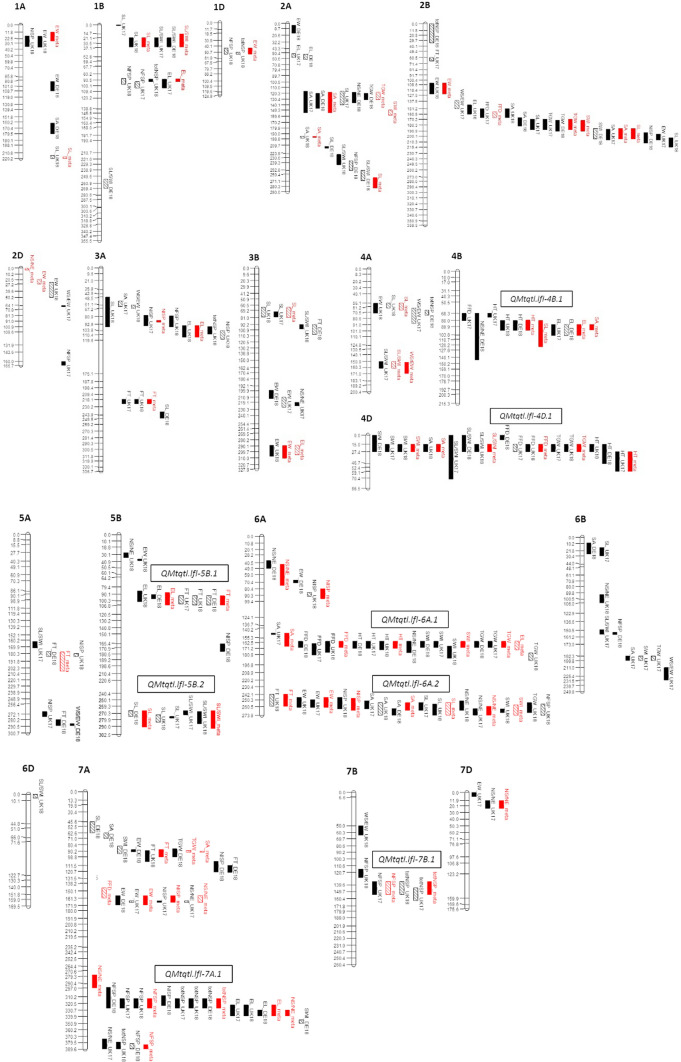
Fig. 2.
The genetic map locations of quantitative trait loci (QTL) identified in the BMWpop grown in field trials undertaken in the United Kingdom in 2017 and 2018 (UK17 and UK 18) and in Germany in 2018 (DE18) using interval mapping and composite interval mapping. Multi-trait QTL (MT-QTL) are also included, and are shown in red. ‘Strong’ QTL, classified as those with -log10p-values higher than the trait-specific p = 0.05 significance thresholds determined by permutation are indicated by solid bars. ‘Weak’ QTL, classified as those with -log10p-values less than the permutated p = 0.05 significance threshold but with -log10p > 3 and which explain ≥ 5% of the phenotypic variation, are indicated by bars with diagonal lines. The BMWpop genetic map is previously published (Stadlmeier et al. 2018)

