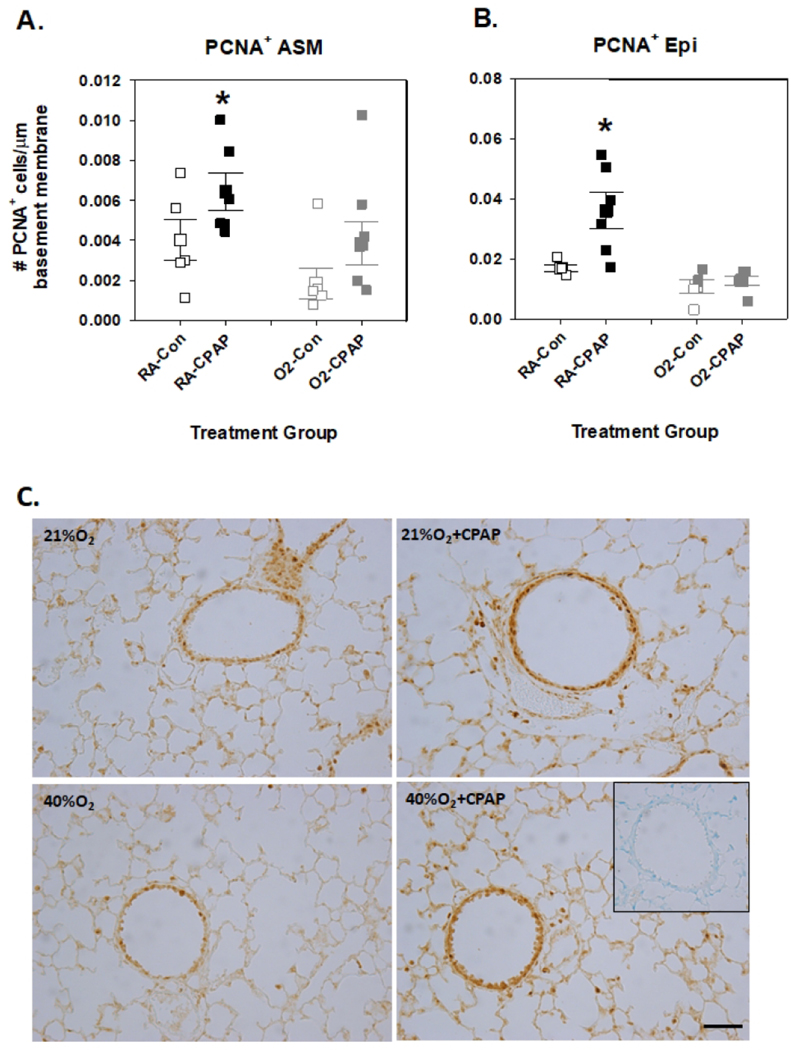
Figure 4:
Analysis of PCNA+ immunoreactivity for airway smooth muscle (A) and epithelium (B) in P21 day old mice following neonatal (P1-7) CPAP with or without prior concomitant hyperoxia exposure. Treatment groups include untreated mice (no CPAP raised in room air, RA-Con; Open black squares), CPAP exposure alone (RA-CPAP, solid squares), hyperoxia exposure alone (O2-Con, open grey squares) and combined CPAP with hyperoxia (O2-CPAP, solid grey squares). Values are mean ± SEM; individual squares represent values for individual animals. * indicates sig different from RA-Con group). Representative images are also shown (C). (N=5–6 airways from 3–4 mice/group).

