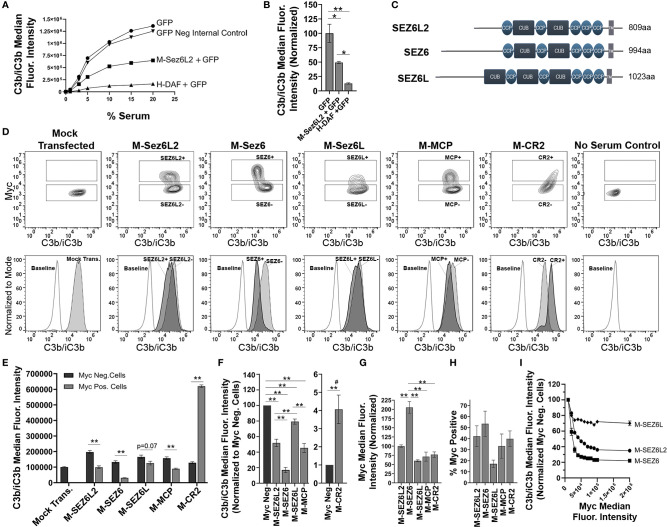
Figure 2.
Full Length Sez6L2, Sez6, and Sez6L inhibit C3b/iC3b opsonization of CHO cells by the classical pathway. (A, B) Sez6L2 inhibits C3b/iC3b opsonization at a range of serum concentrations. CHO cells were transfected with plasmids for GFP alone or with Myc-tagged Sez6L2 (M-Sez6L2) or His-tagged DAF (H-DAF). CHO cells were coated with antibodies and exposed to 0-20% C5-depleted human serum for one hour and then immuno-stained with anti-C3b/iC3b antibodies and analyzed by flow cytometry. One experiment is shown that is representative of two independent experiments. (B) C3b/iC3b on GFP transfected cells with or without M-Sez6L2 or H-DAF at 15% serum. ANOVA (P=0.0016; F(2,6)=22.51). N=3; one experiment with three replicates (representative of 3+ independent experiments). (C) Schematic of Sez6L2, Sez6, and Sez6L protein domain structures. (D–I) CHO cells were transfected with the indicated Myc-tagged cDNAs and processed as outlined in A with 15% C5 depleted serum, except that an anti-Myc antibody was used in place of GFP to identify transfected and expressing CHO cells. (D) 5% Contour plots of C3b/iC3b versus Myc fluorescence (top layer) and C3b/iC3b fluorescence histograms (bottom layer) of the same samples normalized to mode and compared to baseline cells not exposed to serum. For Contour plots, boxed regions highlight cells designated as Myc-positive (top box) and Myc-negative (lower box) populations. For C3b/iC3b histograms, dark grey, solid line population = Myc-positive cells; Light grey, dotted line population= Myc-negative cells; White, dashed grey line population = baseline. Representative of 4+ independent experiments. (E) Quantification of the average median C3b/iC3b fluorescence intensity from Myc-positive and Myc-negative cells within each sample. Statistics = t-tests. N=3 (one experiment with three replicates; Representative of 4+ independent experiments). (F) Average median C3b/iC3b fluorescence intensities after normalization to the Myc-negative cells from each experimental group. ANOVA between Myc-positive cell populations (p<0.001; F(4, 15)=64.53). Sez6L2 inhibits C3b/iC3b opsonization at a level comparable to positive control MCP. Sez6 is a stronger complement inhibitor than Sez6L2 and Sez6L is a weaker inhibitor. (F) Average median Myc fluorescence intensity from Myc-positive cells. ANOVA (p<0.001; F(4, 15)=36.79). (G) Average % of Myc-positive cells in each experimental group (ANOVA, p=0.115; F(4, 15)=2.224). For sections (F–H), N=4 (four independent experiments). (I) Sez6 blocks complement opsonization more efficiently than Sez6L2 and Sez6L even when comparing similar levels of Myc surface expression. Average C3b/iC3b median fluorescence intensity normalized to internal Myc-negative populations for M-Sez6, M-Sez6L2, and M-Sez6L samples shown relative to the Myc median fluorescence intensity. N=3 (one experiment with three replicates, Representative of three independent experiments). For all graphs *p < 0.05; **p < 0.01; #p < 0.001 for all Myc-positive groups compared to M-CR2.

