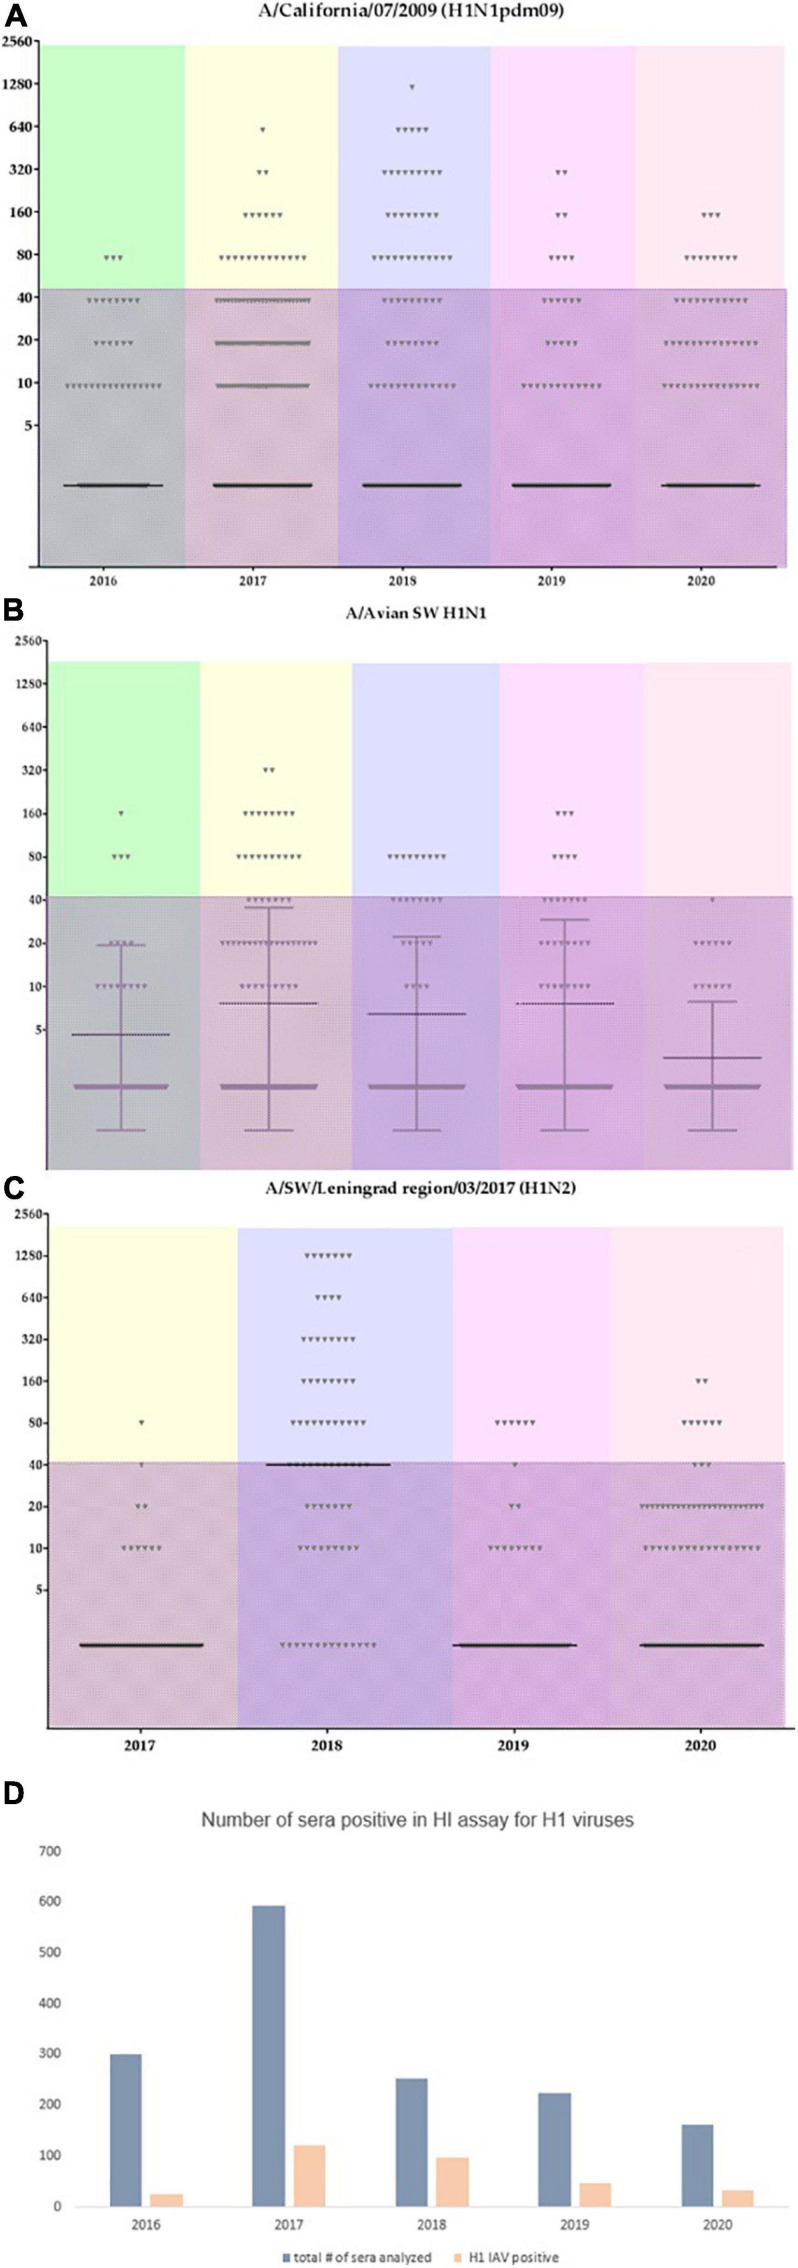
FIGURE 7.
Individual serum titers from swine tested for the most abundant influenza A viruses. Color coding reflects different years. The shaded area marks titers with values of 40 or less. (A) individual titers to A/California/07/2009; (B) individual titers to A/swine/England/195852/1992 (H1avN2); (C) individual titers to A/swine/Leningrad region/03/2017 (H1N2); (D) overall number of sera tested within each year and the overall number of sera which tested positive for the influenza A(H1) subtype.

