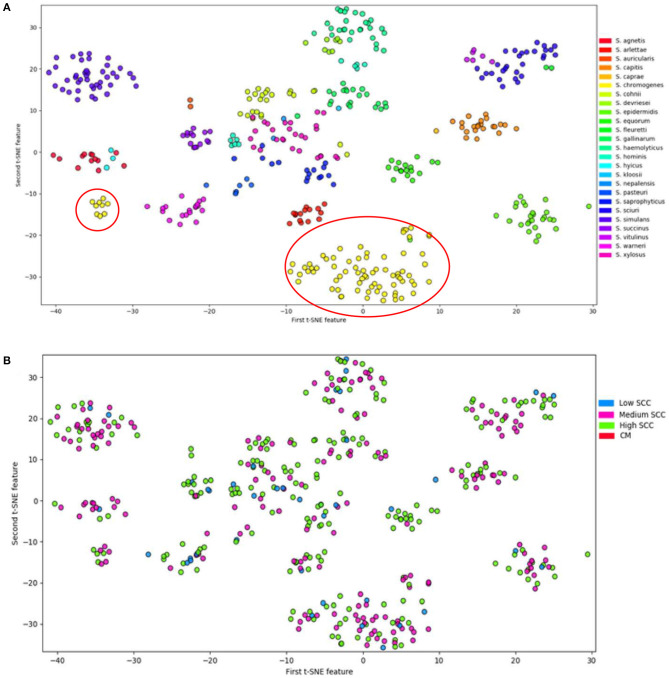
Figure 2.
Visualization of 25 NAS species by t-Distributed Stochastic Neighbor Embedding (T-SNE) based on virulence gene content, demonstrating that each of the NAS species is a discrete microorganism; the red circles indicate the distinctive split between S. chromogenes populations (A). Labeling of severity of mastitis of the NAS isolates separated based on virulence genes (B). Modified from (7).

