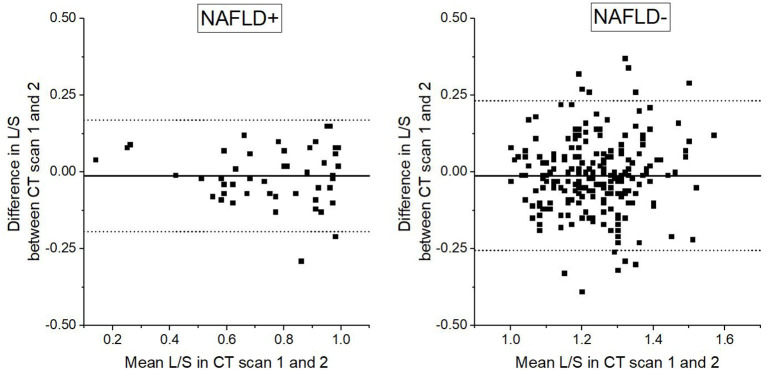
Figure 3.
Bland-Altman plot demonstrating differences in liver to spleen ratio (L/S) based on radiodensity values in repeated low dose computed tomography scans in relation to mean of the two L/S assessments. Straight horizontal line represents mean difference, dotted horizontal lines represent upper and lower 95% limits of agreement. L/S cut of value of 1 is used in division of study population to subjects with non-alcoholic fatty liver disease (NAFLD+) and subjects without non-alcoholic fatty liver disease (NAFLD–).

