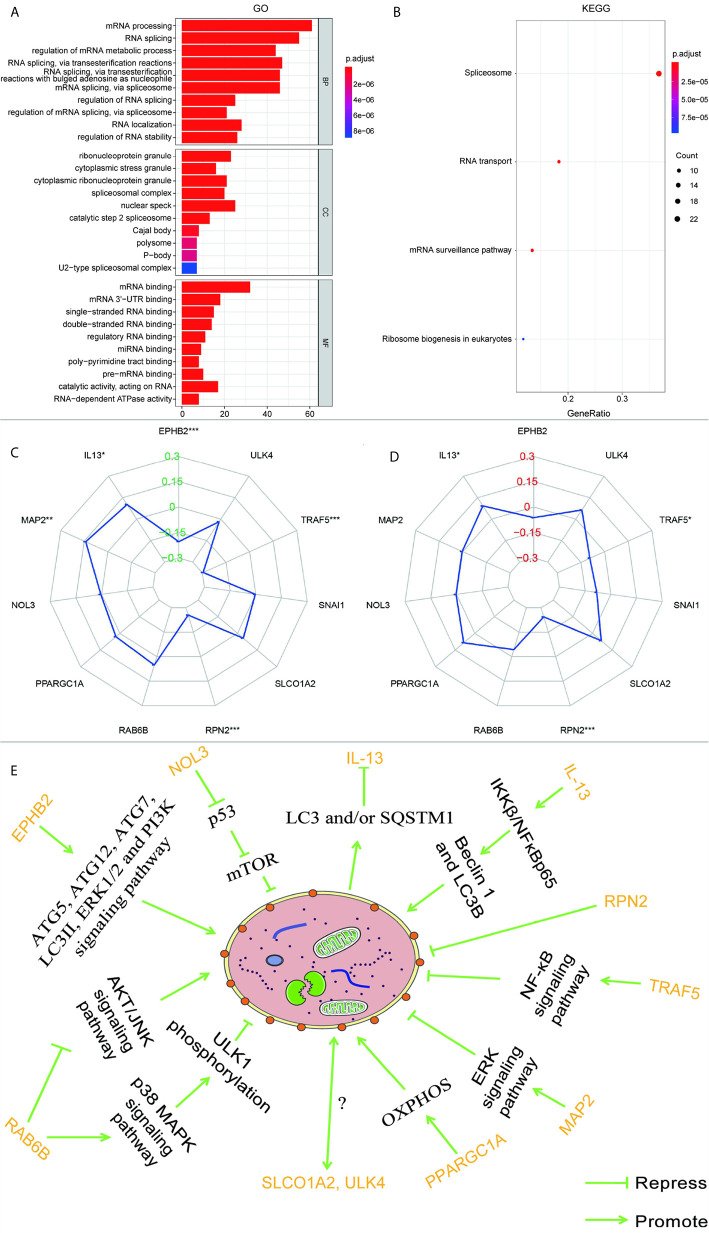
Figure 7.
(A) GO analysis and (B) KEGG analysis of the target genes of 11 autophagy-associated genes in the model. The radar maps of 11 autophagy-associated genes are analyzed with MSI (C) and TMB (D), respectively. Regulatory relationships between the 11 genes in the model and autophagy (E). *p < 0.05, **p < 0.01, ***p < 0.001.

