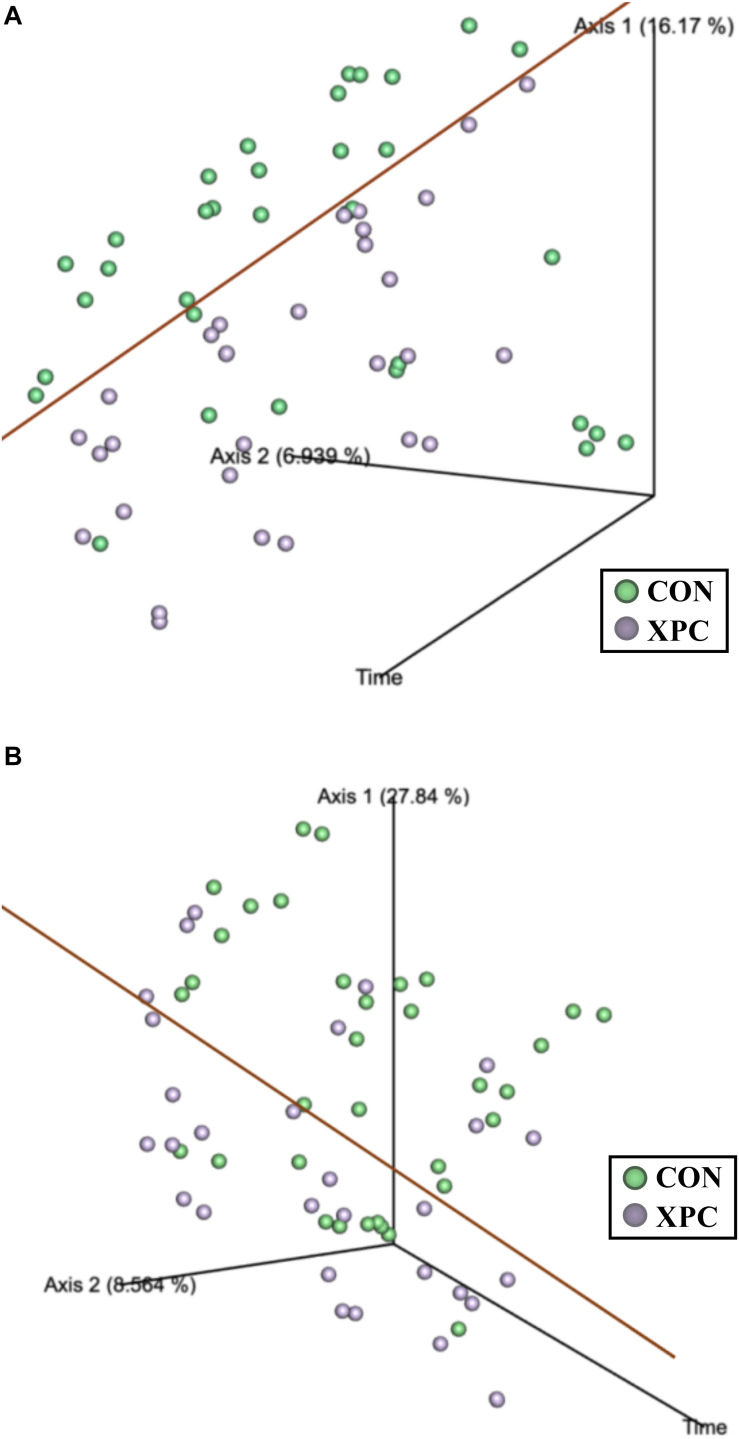
FIGURE 3.
The effect of treatment on of the Jaccard dissimilarity (A) and weighted UniFrac distance (B) matrices of the turkey cecal microbiota at 0, 24, and 48 h post-inoculation (hpi) of Salmonella Typhimurium and Reading during an in vitro turkey cecal model with and without the supplementation of Original XPCTM (P < 0.05, Q < 0.05, n = 16, N = 96). The green data points represent the control cecal cultures, whereas the purple data points represent the XPC treated turkey cecal cultures.

