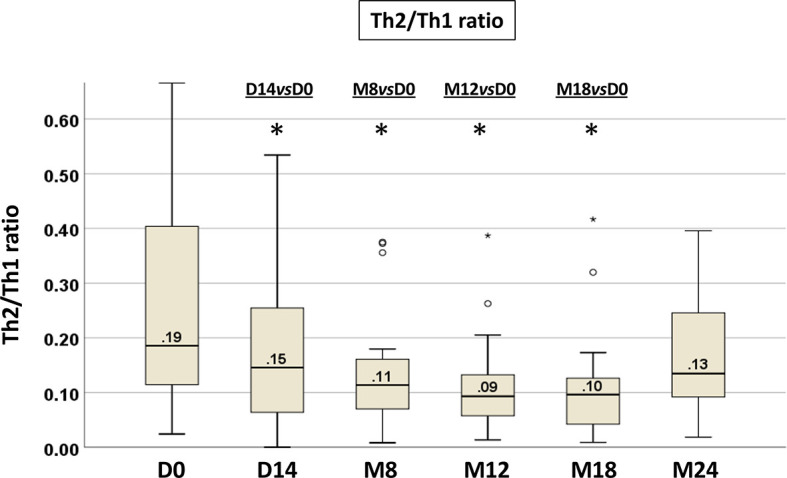
Figure 4.

Longitudinal analysis of the Th2/Th1 ratio from paired PB samples before and during ibrutinib treatment. The intra-individual variations in T-cell production of IL-4 and IFNγ are expressed as Th2/Th1 ratio. Samples at D0, n=71; at D14, n=50; at M8, n=30; at M12, n=25; at M18, n=22; at M24, n=10 (Wilcoxon paired test D14 vs D0, M8 vs D0, M12 vs D0, M18 vs D0, M24 vs D0; *p<0.05).
