Figure 6.

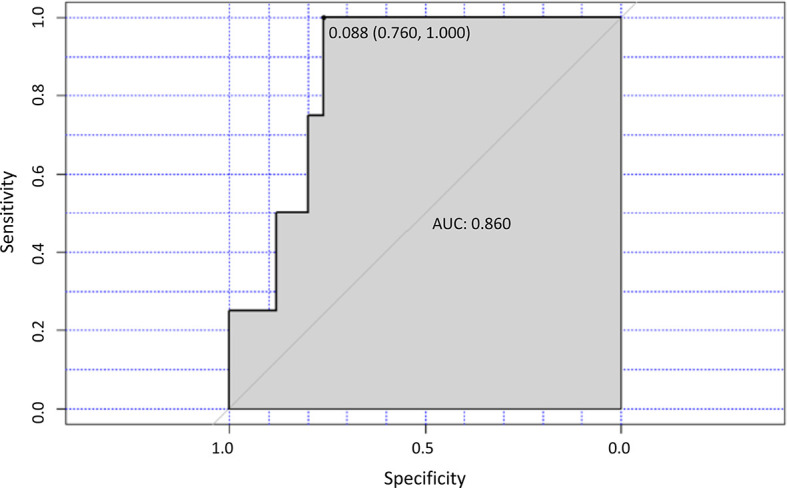
Th2/TH1 ratio and response to treatment. ROC curve analysis for the optimal cut-off point of the Th2/Th1 ratio at M8 of ibrutinib treatment. The area under the curve (AUC) value for the Th2/Th1 ratio was 0.860.

Th2/TH1 ratio and response to treatment. ROC curve analysis for the optimal cut-off point of the Th2/Th1 ratio at M8 of ibrutinib treatment. The area under the curve (AUC) value for the Th2/Th1 ratio was 0.860.