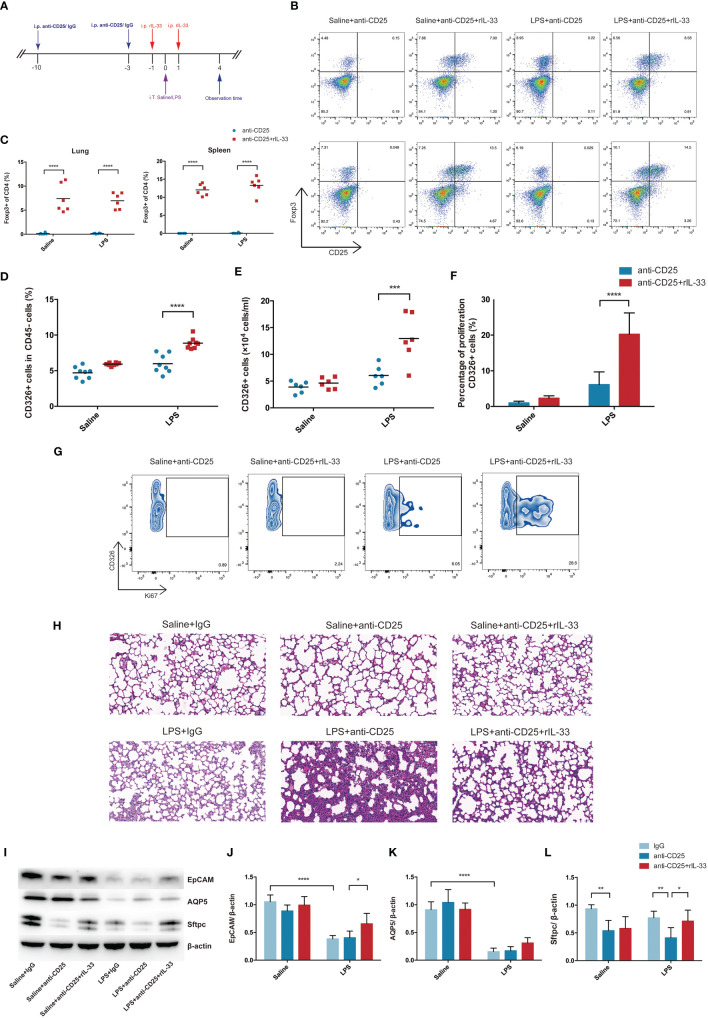
Figure 8.
Transfer of recombinant mouse IL-33 into Treg depletion mice restored Treg cells and promoted lung epithelial regeneration. (A) Schematic diagrams of IL-33 supplementation in Treg depleted mice during LPS-induced ARDS. Mice were intraperitoneally injection with 100 µg of anti-CD25 antibody or IgG 10 days before LPS exposure and repeatedly treated every 7 days for continuous Treg depletion. Then 1 day before and after LPS administration, rIL-33 (2 mg/mouse) were intraperitoneally injected into mice. Mice were sacrificed at 4 day after LPS administration. (B) Cytofluorometric dot plots of Treg cells in Saline+anti-CD25, Saline+anti-CD25+rIL-33, LPS+anti-CD25, LPS+anti-CD25+rIL-33 group. Numbers depict the fraction of CD4+ T cells within the designated gate. The upper panels display the Treg cells in lung, and the lower panels display the Treg cells in spleen. (C) Summary data for the percentage of Treg cells in the lung or spleen depicted in (B). (D) Summary data for the percentage and (E) number of epithelial cells in the lungs. (F) Percentage of proliferating epithelial cells in the lung. (G) Zebra plots of proliferating epithelial cells percentage in different groups in the lung. (H) Histopathological staining. Representative HE staining of lung sections were shown in Saline+IgG, Saline+anti-CD25, Saline+anti-CD25+rIL-33, LPS+IgG, LPS+anti-CD25, LPS+anti-CD25+rIL-33 group. Original magnification = 200×, scale bar represents 50 μm. (I–L) EpCAM, AQP5, and Sftpc protein was estimated by Western blotting. For all panels: mean ± S.D. *p ≤ 0.05; **p ≤ 0.01; ***p ≤ 0.001; and ****p ≤ 0.0001 for one-way analysis of variance with the Bonferroni post hoc test for multiple t-tests. A value of p < 0.05 was considered statistically significant. n = 6–8 mice per group.

