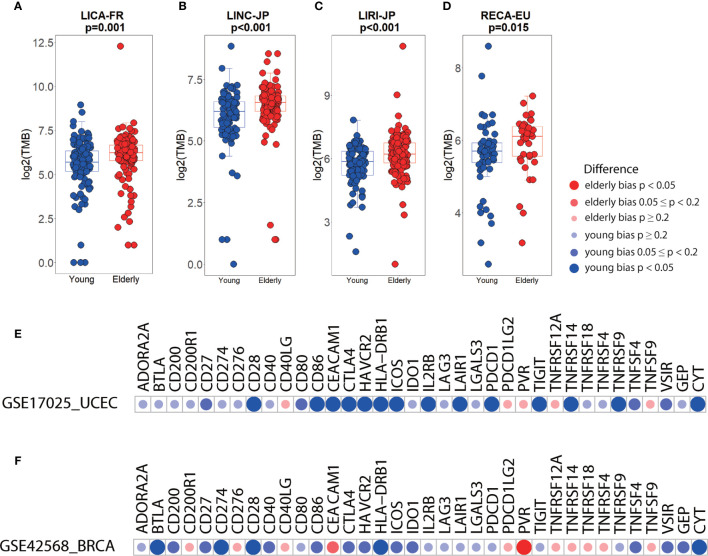
Figure 4.
Differences in immune biomarkers between elderly and young patients in independent datasets. (A–D) Boxplots showing the differences in TMB between elderly and young patients with liver cancer (a, LICA-FR; b, LINC-JP; c, LIRI-JP) and renal cell cancer (d, RECA-EU). Boxplot center line, bounds of box and whiskers represent median, inter-quartile range and outliers. (E) Checkpoints, GEP, and CYT between elderly and young patients with UCEC (GSE17025, elderly= 26, young= 60) and BRCA (GSE42568, elderly= 36, young= 68).

