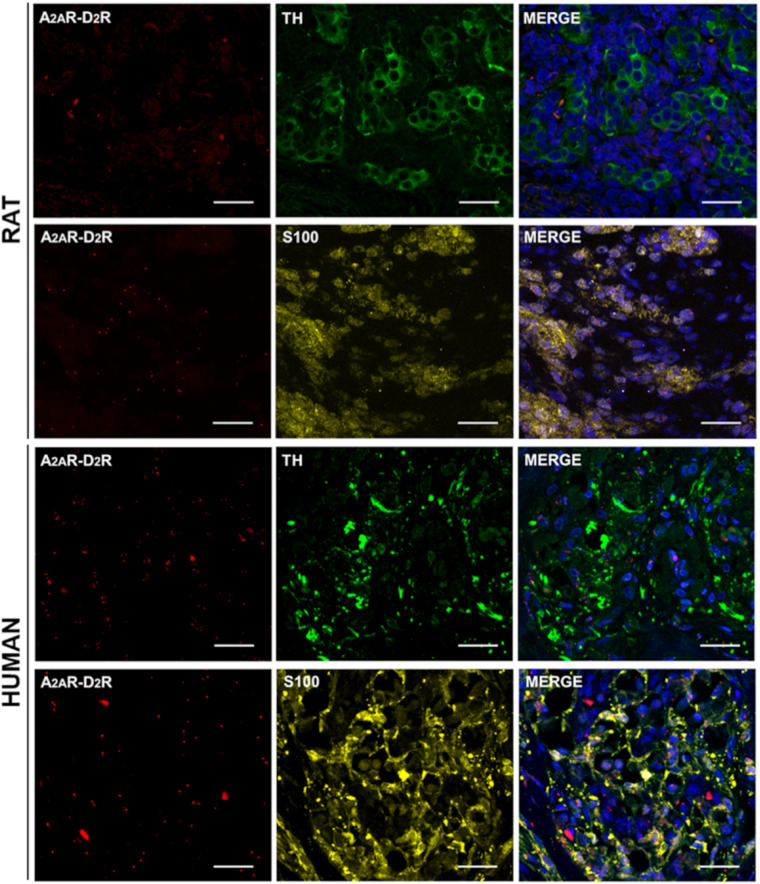
FIGURE 4.
TH and S100 immunofluorescence in representative rat and human CB samples after A2AR–D2R PLA. Red dots showed A2A–D2 receptors heterodimers; anti-TH (visualized in green) and anti-S100 (visualized in yellow) staining allowed to distinguish type I and type II cells, respectively. Cell nuclei were recognizable after DAPI staining (visualized in blue) in the merge images. Scale bar: 25 μm.

