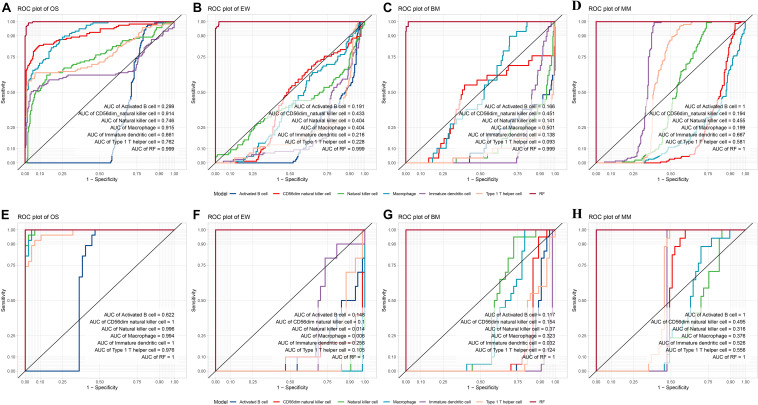
FIGURE 4.
Internal and external validation of the diagnostic model. (A–D) ROC plot of the Random forest model compared with a single variable diagnostic model per disease in the test dataset. (E–H) ROC plot of the random forest model compared with a single variable diagnostic model per disease in the validation dataset. ROC, receiver operating characteristic; MM, multiple myeloma; EW, Ewing’s sarcoma; BM, prostate cancer bone metastases; OS, osteosarcoma; RF, the random forest diagnostic model.

