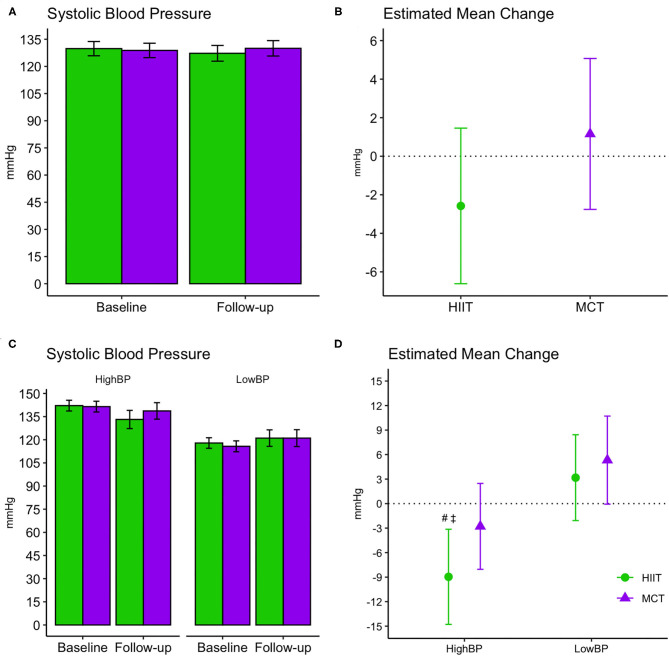
Figure 6.
Baseline and follow-up means for systolic blood pressure readings (A,C, group mean and 95% CI) and estimated mean change from baseline to 6 months (B,D, estimated mean change and 95% CI). (A,B) Display changes for the entire sample, while (C,D) display changes within subgroups stratified by baseline systolic blood pressure readings. #, significant changes over time at adjusted significance threshold (p ≤ 0.005); See Supplementary Table 2 for further details. ‡, greater changes compared to HIIT Low BP [difference between groups (CI): −12.14 mmHg (−19.98 to −4.30), p = 0.003] and MCT Low BP [−14.28 mmHg (−22.22 to −6.35), p = 0.001] at adjusted significance threshold (p ≤ 0.005). CI, confidence interval; HIIT, high-intensity interval training; MCT, moderate-intensity continuous training; High BP, high systolic blood pressure at baseline; Low BP, low systolic blood pressure at baseline.

