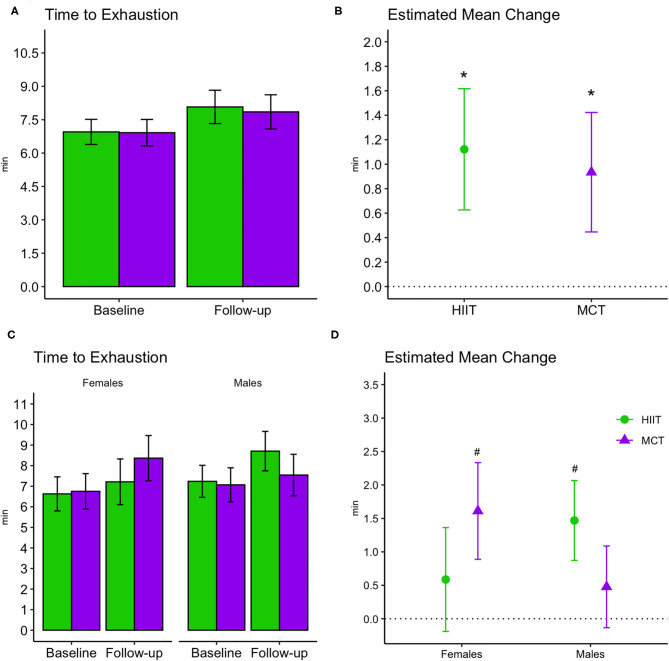
Figure 7.
Baseline and follow-up means for time to exhaustion during exercise stress tests (bar plots, group mean and 95% CI) and estimated mean change from baseline to 6 months (scatterplots, estimated mean change and 95% CI). (A,B) Display changes for the entire sample, while (C,D) display changes stratified by males and females. *, significant changes over time; #, significant subgroup changes over time at adjusted significance threshold (p ≤ 0.005), with improvements in females within the MCT group [estimated mean change (95% CI): 1.61 min (0.9 to 2.33), p = 0.00003] and males within the HIIT group [1.47 min, (0.87 to 2.07), p = 0.000006]. See Supplementary Table 3 for further details. HIIT, high-intensity interval training; MCT, moderate-intensity continuous training.

