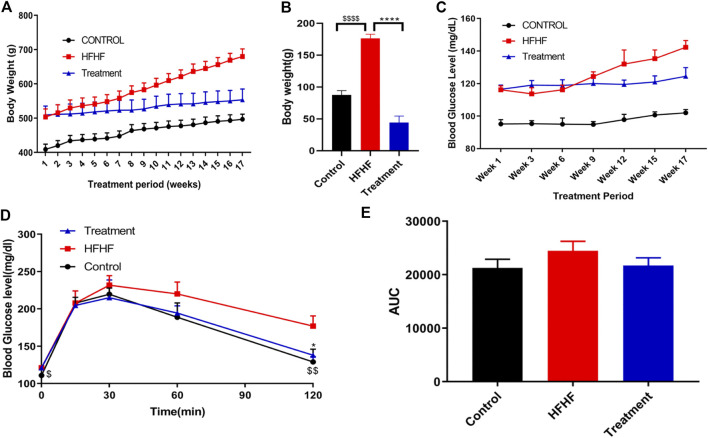
FIGURE 1.
Effect of Lysimachia candida Lindl. extract administration on the physical parameters of rats (A) Body weight, (B) Body weight change, (C) Fasting blood glucose, (D) IPGTT, (E) AUC of glucose level. Data are expressed as mean ± SD (n = 6) each group, p < 0.0001 **** signifies the statistical difference between HFHF and Treatment, p < 0.05 * signifies the statistical difference between HFHF and Treatment, p < 0.0001 $$$$ signifies the statistical difference between HFHF and Control, p < 0.005 $$ signifies the statistical difference between HFHF and Control, p < 0.05 $ signifies the statistical difference between HFHF and Control.

