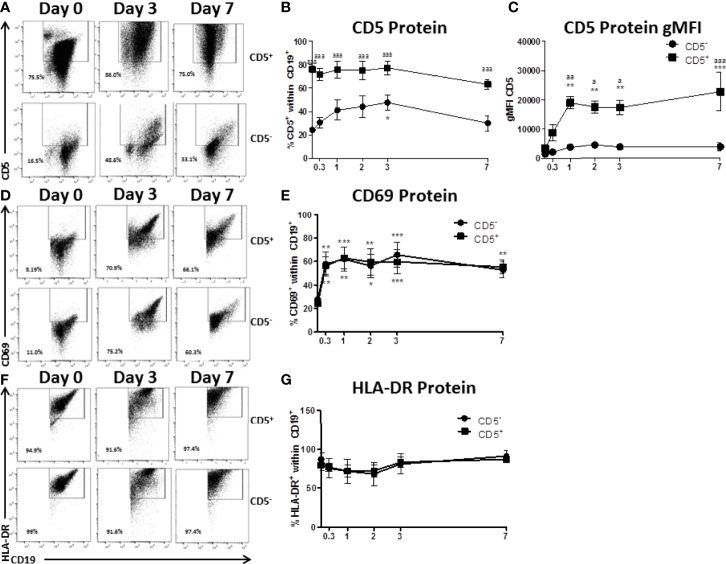
Figure 3.
CD5+ B cells remain strongly CD5 positive while CD5- B cells transiently acquire CD5 expression despite similar activation-induced profiles of CD69 and HLA-DR. CD19+ B cells were isolated from PBMC as previously described and then surface stained for 30 min with anti-CD5-PE antibody. Cells were then incubated with anti-PE biotin beads for 15 min, washed, incubated with strepavidin-ferous beads, and isolated by positive selection based on CD5 expression. CD5 positive and negative cells were activated as previously described or taken at day 0 for purity stain and quantification of CD69 and HLA-DR. At each indicated time point, cells were collected and surface stained for CD19, CD5, CD69, and HLA-DR. For comparison of cell types, all data is on gated CD19+ cells within the live lymphocyte gate. Representative flow plots for CD5 expression at select times are shown in (A) Cell surface CD5 protein expression over time is shown for all donors in panel (B) The geometric mean fluorescence intensities of the per cell basis level of expression for CD5 is shown in panel (C) Representative flow plots of CD69 positive cells at select times are shown in (D) Cell surface CD69 protein expression over time is shown for all donors in panel (E) Representative flow plots of HLA-DR positive cells at select times are shown in (F) Cell surface HLA-DR protein expression over time is shown for all donors in panel (G) Data shown are from 3 independent experiments assessing a total of 5 human donors. Significant differences compared to day 0 were determined within each cell type by a one-way ANOVA with a Tukey’s posttest where *p < 0.05, **p < 0.01, and ***p < 0.001. Significance between cell types at a given timepoint was determined with a two-way ANOVA with a Tukey’s posttest where ap < 0.05, aap < 0.01 and aaap < 0.001.

