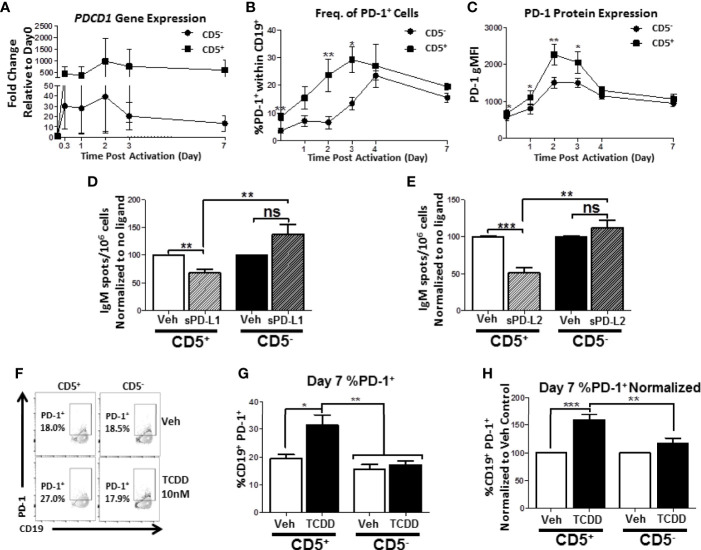
Figure 9.
Human CD5+ B cells display enhanced PD-1 expression kinetics compared to CD5- B cells and TCDD treatment results in a significant increase in day 7 CD5+ PD-1+ B cells. Human CD5+ and CD5- B cells were isolated, activated, and, where indicated, treated with sPD-L1 (1μg/mL), sPD-L2 (0.1μg/mL) or TCDD (10nM) for 7 days as previously described. At the indicated times, cells were collected for either RNA analysis for PDCD1 mRNA expression or surface stained with anti-PD-1 antibody and the frequency of cell surface PD-1 protein expression quantified by flow cytometry. In panel (A), the fold change in PDCD1 mRNA at indicated times compared to day 0 is shown, corresponding to 4 independent experiments assessing a total of 7 human donors. PD-1+ cells were identified in the lymphocyte singlet gate by gating on live CD19+ cells with the kinetics of PD-1 protein expression following B cell activation is shown in panels (B, C) corresponding to 2-4 independent experiments analyzing 4-8 human donors. Averaged, normalized IgM ELISPOT results from sPD-L1 and sPD-L2-treated CD5+ and CD5- B cells assessing 11 human donors corresponding to 4 independent experiments is shown in panels (D, E), respectively. Representative flow plots for Veh and TCDD treated CD5+/- B cells are shown in panel (F). Averaged frequency of PD-1+ cells, both raw and normalized to Veh control, are shown in panels (G, H) from 2 independent experiments assessing a total of 6 human donors. Significance in panels (D, E, G, H) was determined by a repeated measures two-way ANOVA with a Tukey’s posttest. ns=not significant, *p < 0.05, **p < 0.01, and ***p < 0.001. A paired, repeated measures t-test was used to determine significance at each indicated time post-activation (B, C) where *p < 0.05 and **p < 0.01.

