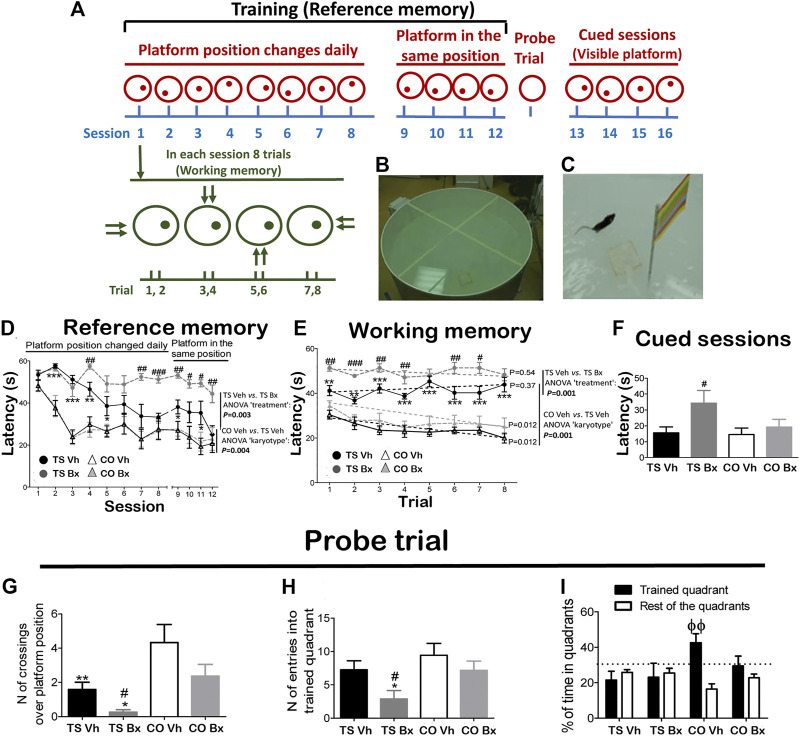
FIGURE 1.
Schematic drawing of the MWM protocol (A), and representative image of the apparatus during the training (B), and cued (C) sessions. Mean ± S.E.M of the latency to reach the platform during the twelve acquisition sessions (D), during each trial of the first eight acquisition sessions (E), and mean latencies to reach the platform during the four cued sessions (F), of the number of crossings over the platform position (G), the number of entries in the trained quadrant (H), and the mean percentage of time spent in the trained quadrant vs. the mean time spent in the rest of the quadrants (I), during the probe trial by TS and CO mice under bexarotene or vehicle treatment. *: p < 0.05, **: p < 0.01, ***: p < 0.001: TS Vh vs. CO Vh or TS Bx vs. CO Bx; #: p < 0.05, ##: p < 0.01, ###: p < 0.001 TS Bx vs. TS Vh; ϕϕ: p < 0.01 trained quadrant vs. rest of the quadrants. Fisher’s LSD post-hoc tests. On the right side of the A and B figures, the p-value of the difference between the TS Bx and the TS Vh, and between the TS Vh and CO Vh learning curves across the twelve sessions (RM ANOVAs) is shown. In the B figure, the dotted lines and the p-values beside them represent the significance of the change in latency across the trials (RM ANOVA ‘trial’ of each learning curve). The dotted lines in figure C represent the chance level, i.e. a probability equal to 25%.

