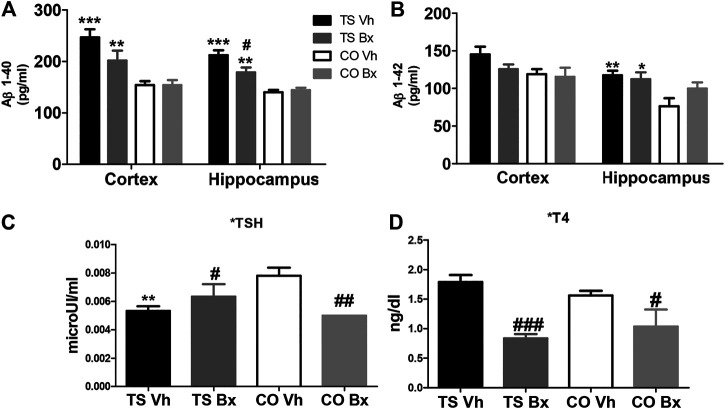
FIGURE 5.
Means ± S.E.M. of the levels of Aβ1-40 (A), and Aβ1-42 (B) in the cortices and hippocampi of TS and CO mice under bexarotene or vehicle treatment and of the levels of TSH (C), and T4 (D) in the four groups of mice. *: p < 0.05, **: p < 0.01; ***: p < 0.001 TS Vh vs. CO Vh, or TS Bx vs. CO Bx; #: p < 0.05; ##: p < 0.01; ###: p < 0.001 TS Bx vs. TS Vh, or CO Bx vs. CO Vh. Fisher’s LSD post-hoc tests.

