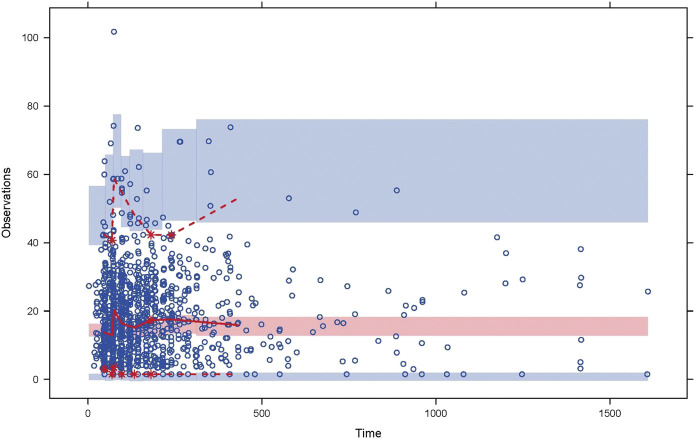
FIGURE 2.
Visual predictive check for the final population pharmacokinetic model. The circles are the observations. The solid and dashed lines represent the median, 2.5th, and 97.5th percentiles of the observations; the shaded pink and blue areas represent the 95% confidence interval of the median, 2.5th, and 97.5th percentiles predicted by the model.

