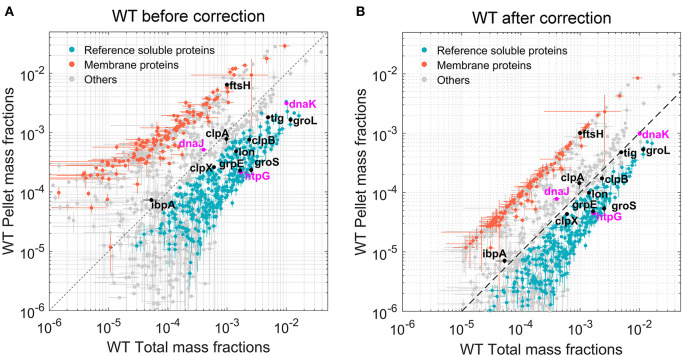
Figure 2.
Quantitation of the most abundant soluble and insoluble proteins in wild-type (WT) Escherichia coli cells. Scatter plot of the relative mean mass fractions of 1,421 proteins from WT W3110 E. coli that were significantly quantified in the total fraction containing both soluble and insoluble proteins (X-axis), against only in the insoluble pellet fraction, containing mostly the insoluble proteins (Y-axis). (A) Before correction for the overrepresentation of the insoluble proteins in the pellet fractions. (B) After correction. Orange dots: 281 membrane proteins identified as such by the Uniprot database. Blue dots below the hatched line: proteins with a significant solubility index equal or >90%. Gray circles: other less significantly soluble proteins. Magenta dots: DnaK, DnaJ, and HtpG. Black dots, other canonical chaperones and major proteases.

