Figure 6.
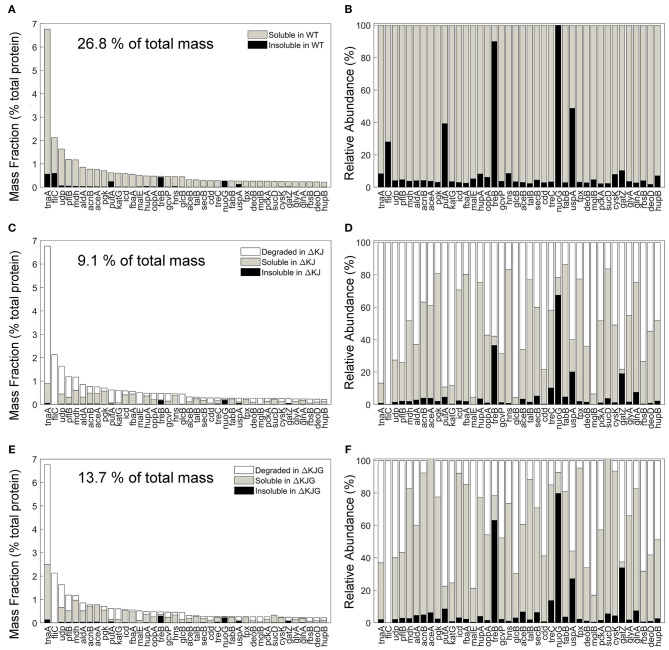
Protein degradation is a prevalent phenotype in ΔKJ and partially rescued in ΔKJG. (A) Absolute abundances (mass fractions of the total cellular protein amount) in wild-type (WT) soluble and insoluble fractions for the 40 most abundant proteins of WT Escherichia coli that were downregulated in ΔKJ. (B) Normalized abundances in WT E. coli of the same proteins as in (A). (C) Absolute abundances of the same proteins as in (A), but with a partitioning showing the amounts of each protein degraded in ΔKJ (white bars); the soluble (gray bars) and insoluble (black bars) amounts in. (D) Same as in (C), with normalized abundances. (E) Same absolute abundances as in (A,C), but partitioned in order to show the quantities degraded in ΔKJG with respect to WT (white bars); the soluble (gray bars) and insoluble (black bars) amounts in ΔKJG. (F) Same as in (E), with normalized abundances.

