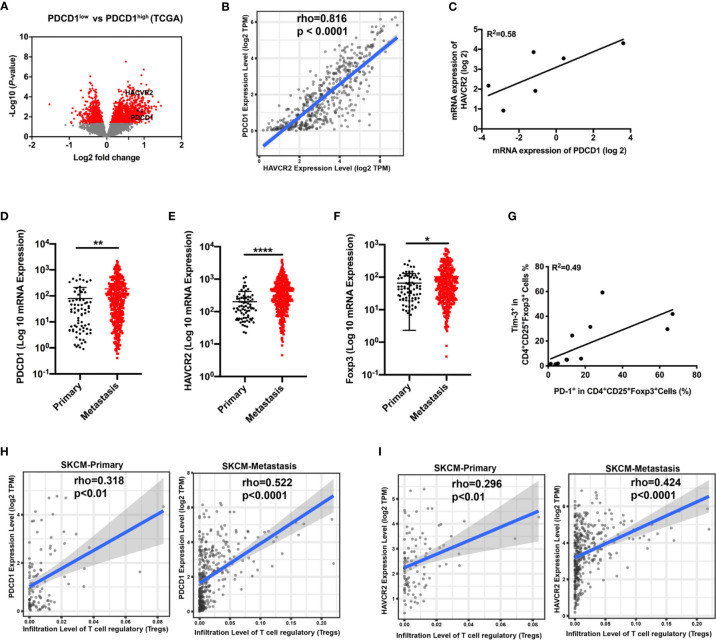
Figure 1.
Correlation of PDCD1 expression and HAVCR2 in melanoma. (A) Volcano plot showing enrichment of differentially expressed genes in the PD-1high and PD-1low sub-populations from the TCGA dataset (n=472). Significantly different genes (PDCD1 and HAVCR2) are plotted in black (log2 fold change > 0.5, p < 0.05). (B) Correlation between PDCD1 (PD-1) and HAVCR2 (Tim-3) expression in human melanoma samples from the TCGA dataset (n=472). (C) Association between the mRNA level of PDCD1 (PD-1) and HAVCR2 (Tim-3) from Pearson correlation of melanoma biopsies (n=6; R2 values by linear regression). (D–F) PDCD1 (D), HAVCR2 (E), and Foxp3 (F) expression in primary and metastatic melanoma patients from the TCGA dataset. (G) Relationship of PD-1 and Tim-3 expression on Treg cells in PBMCs from healthy donors (n=9; R2 values by linear regression). (H, I) Correlation between PDCD1 (H) or HAVCR2 (I) expression and Treg cells infiltration in primary and metastasis melanoma patients’ samples from the TCGA datasets. *p ≤ 0.05, **p ≤ 0.01, ****p ≤ 0.0001.

