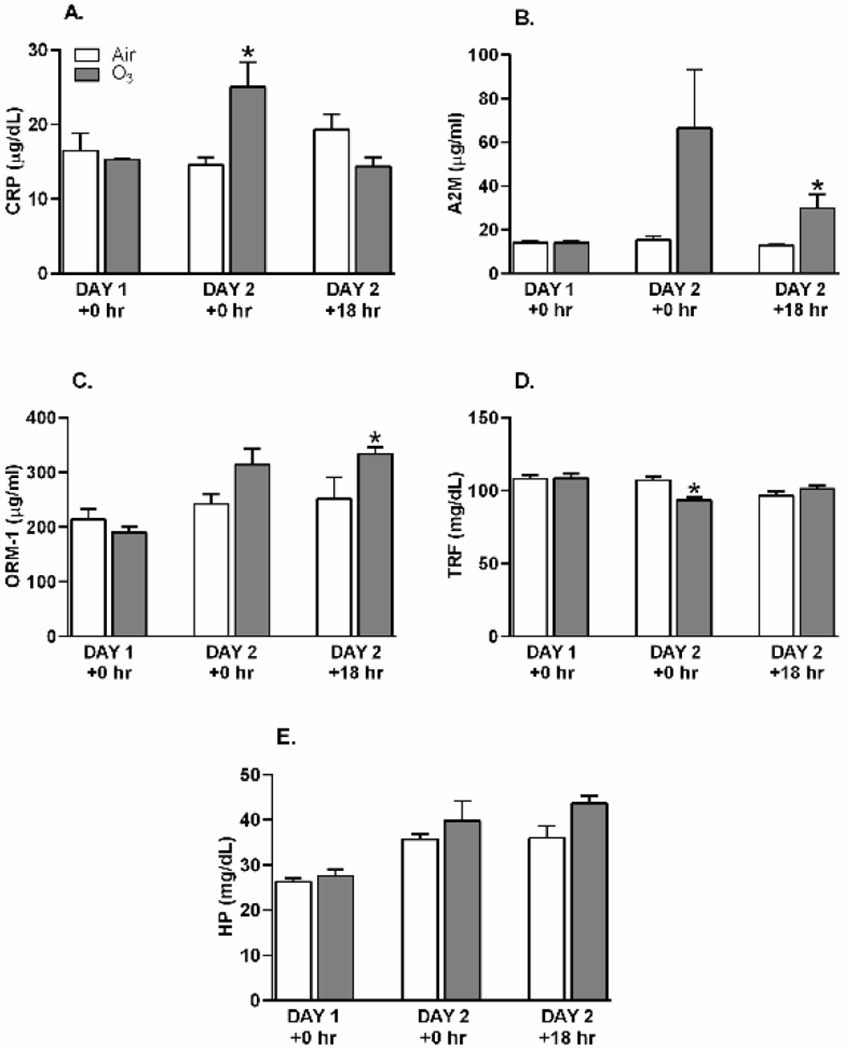
Figure 2.

Alterations in serum APP concentrations after O3 exposure. Rats were exposed to air or ozone (O3) (1 ppm, 6 hr/day) for 1 (Day 1 +0 hr) or 2 (Day 2 +0 hr) consecutive days and samples collected within 2 hr post exposure. An additional group of rats was exposed to air or O3 for 2 days and allowed an 18 hr recovery before collecting samples (Day 2 +18 hr). A. C-reactive protein (CRP), B. α2-macroglobulin (A2M), C. orosomucoid-1 (ORM-1), D. transferrin (TRF), and E. haptoglobin (HP). Bar graphs show mean ± SEM of n=6-8/group, with * indicating a significant (p ≤ 0.05) O3 effect.
