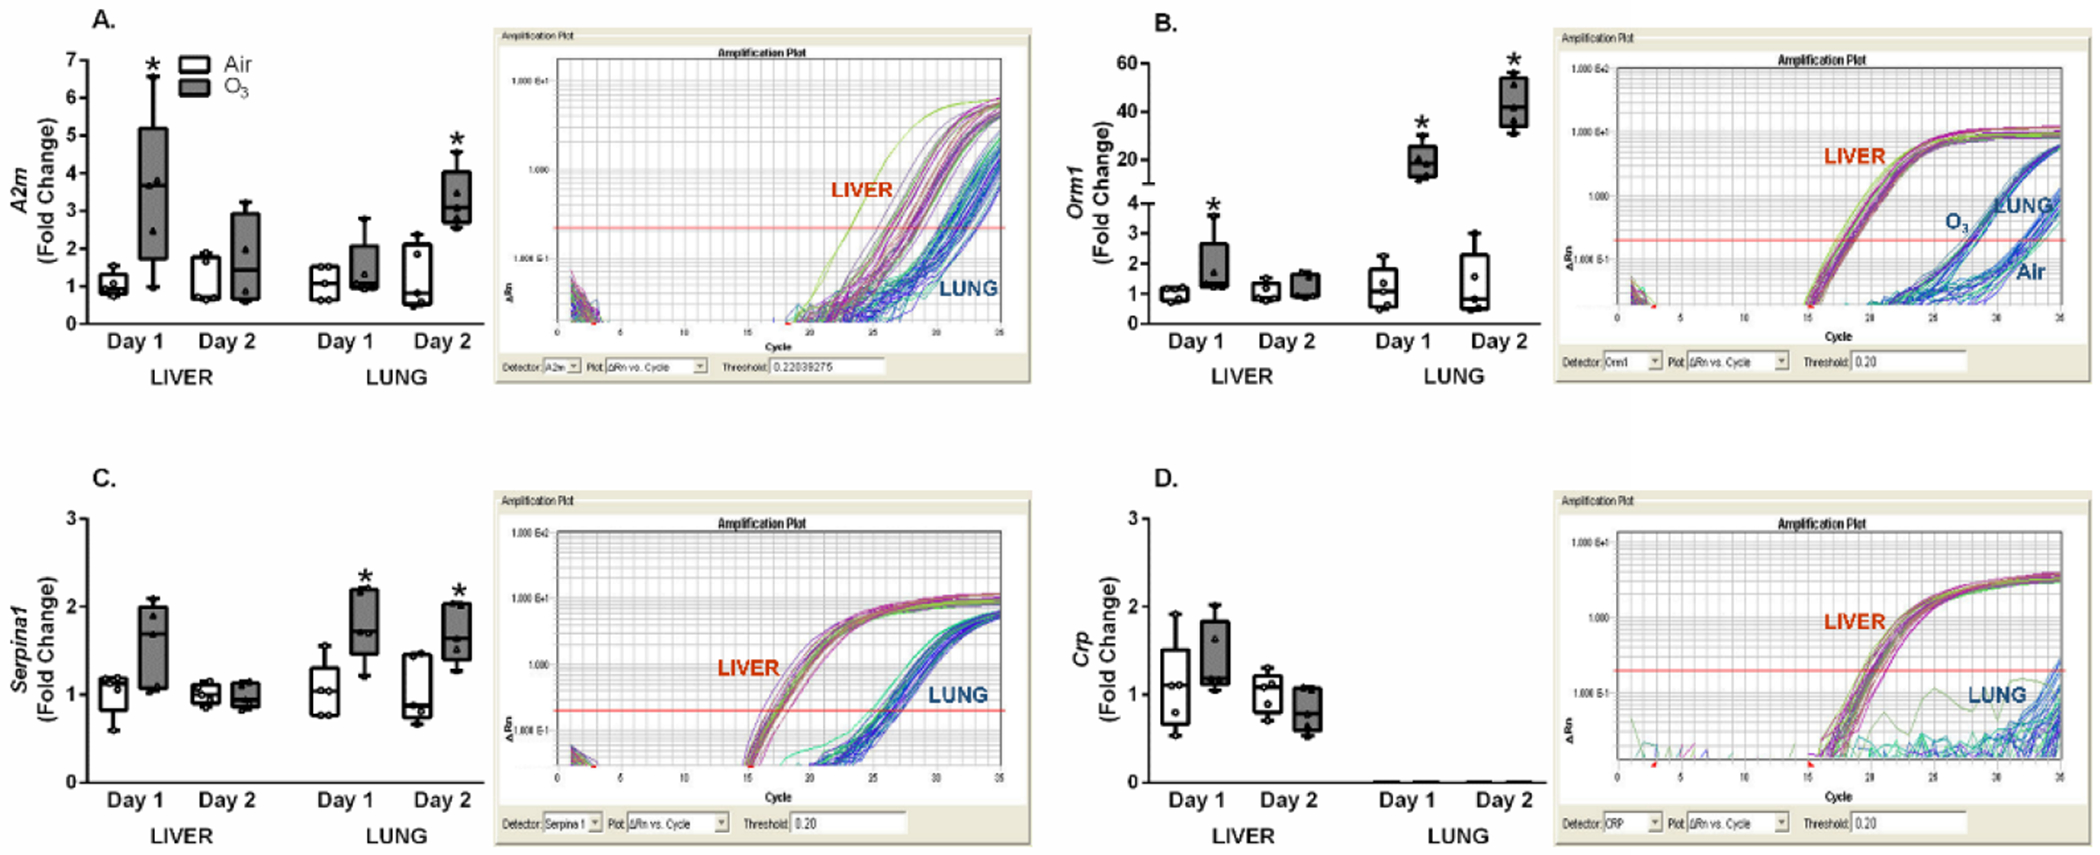
Figure 3.

O3-induced alterations in inflammation and injury associated APPs in lung and liver. Lung and liver mRNA expression was assessed using qRT-PCR for rats exposed to air or ozone (O3) (1 ppm, 6 hr/day) for 1 (Day 1) or 2 (Day 2) consecutive days. Relative fold changes from air controls are indicated in box and whisker plots, along with captured PCR amplification plots to compare relative abundance of given genes in liver versus lung (note that Actb was similarly expressed at a given RNA concentration in both tissues); A. α2-macroglobulin (A2m), B. orosomucoid-1 (Orm1), C. serpin peptidase inhibitor, clade A, member 1 (Serpina1), and D. C-reactive protein (Crp). Box and whisker plots show all points (n=4-5/group). A significant (p ≤ 0.05) O3 effect is indicated by an *.
