Abstract
Purpose
To develop a deep learning approach to bone age assessment based on a training set of developmentally normal pediatric hand radiographs and to compare this approach with automated and manual bone age assessment methods based on Greulich and Pyle (GP).
Methods
In this retrospective study, a convolutional neural network (trauma hand radiograph–trained deep learning bone age assessment method [TDL-BAAM]) was trained on 15 129 frontal view pediatric trauma hand radiographs obtained between December 14, 2009, and May 31, 2017, from Children’s Hospital of New York, to predict chronological age. A total of 214 trauma hand radiographs from Hasbro Children’s Hospital were used as an independent test set. The test set was rated by the TDL-BAAM model as well as a GP-based deep learning model (GPDL-BAAM) and two pediatric radiologists (radiologists 1 and 2) using the GP method. All ratings were compared with chronological age using mean absolute error (MAE), and standard concordance analyses were performed.
Results
The MAE of the TDL-BAAM model was 11.1 months, compared with 12.9 months for GPDL-BAAM (P = .0005), 14.6 months for radiologist 1 (P < .0001), and 16.0 for radiologist 2 (P < .0001). For TDL-BAAM, 95.3% of predictions were within 24 months of chronological age compared with 91.6% for GPDL-BAAM (P = .096), 86.0% for radiologist 1 (P < .0001), and 84.6% for radiologist 2 (P < .0001). Concordance was high between all methods and chronological age (intraclass coefficient > 0.93). Deep learning models demonstrated a systematic bias with a tendency to overpredict age for younger children versus radiologists who showed a consistent mean bias.
Conclusion
A deep learning model trained on pediatric trauma hand radiographs is on par with automated and manual GP-based methods for bone age assessment and provides a foundation for developing population-specific deep learning algorithms for bone age assessment in modern pediatric populations.
Supplemental material is available for this article.
© RSNA, 2020
See also the commentary by Halabi in this issue.
Summary
A deep learning model, trained to predict chronological age on a large dataset of pediatric trauma hand radiographs, performed as well as pediatric radiologists and other deep learning models using the Greulich and Pyle method for pediatric bone age assessment.
Key Points
■ A convolutional neural network trained to predict chronological age based on normal hand radiographs was on par with deep learning algorithms using Greulich and Pyle and pediatric radiology interpretation using Greulich and Pyle.
■ Deep learning–based bone age assessment was more prone to systematic biases, with a tendency to overpredict age for younger children.
■ This work provides a foundation for developing population-specific deep learning algorithms for bone age assessment in modern pediatric populations, in contrast to the Greulich and Pyle method created on a limited pediatric sample in the 1950s.
Introduction
Radiographic bone age assessment is an important component of the diagnostic workup for a variety of pediatric endocrine, metabolic, and growth disorders (1,2). While several methods of bone age assessment exist, the most widely used is direct visual comparison of an individual patient’s left hand and wrist radiograph with the Greulich and Pyle (GP) Radiographic Atlas of Skeletal Development of the Hand and Wrist (3–5). In a 2016 survey of pediatric radiologists, more than 97% used the GP atlas (3). Despite its broad acceptance in clinical practice, the GP method is subject to human factor limitations of inter- and intraobserver variability (4–8). The Tanner-Whitehouse method of bone age assessment is a more reliable alternative to GP; however, it is relatively labor intensive and time-consuming (4).
There has been growing interest in the development of automated methods for bone age assessment to improve on the efficiency, accuracy, and reliability of human interpretations. Recent approaches have used deep learning and convolutional neural networks, which learn imaging features relevant to particular tasks from large datasets, without programming explicit rules or extracting specific features (shape, texture, etc) (9–17). Interestingly, several recent studies of automated bone age assessment report methods that draw from ground truth (known as supervised machine learning) established through reference to GP, with many using extracted bone ages from clinical reports (11,15). For example, the Radiological Society of North America (RSNA) Pediatric Bone Age Challenge used a training dataset of more than 12 000 hand and wrist radiographs obtained clinically for bone age assessment where bone age determined by GP was extracted from clinical reports (16). Inherent to these prior methods is the reliance on GP as both the training and evaluation standards.
Therefore, two questions arise regarding how to best optimize training for automated bone age assessment algorithms: (a) Should ground truth be determined from a pediatric sample clinically requiring a bone age examination for underlying systemic abnormalities, and (b) should ground truth be established from a skeletal age assigned by human interpretation using the GP atlas? Our study proposes an alternative approach to methods used in prior studies by training on data from normal pediatric hand radiographs and using chronological age as ground truth, as opposed to human interpretation using previously described methods such as GP.
The purpose of our study was to develop a GP-independent deep learning model for automated bone age assessment (DL-BAAM) by training the algorithm to assess chronological age using bone morphology from a training set of more than 10 000 pediatric trauma hand radiographs in a large academic children’s hospital with a diverse population. This trauma hand radiograph–trained DL-BAAM (TDL-BAAM) learns bone age patterns corresponding to a relatively healthy and diverse population in hopes to be generalizable to other populations and to provide a potential example of how to approach the establishment of a population-specific TDL-BAAM. We tested our TDL-BAAM on trauma hand radiographs in a geographically and demographically distinct population and compared the performance to both automated and manual bone age assessment by the GP method.
Materials and Methods
Study Design and Datasets
This was a retrospective study comparing several methods for bone age assessment. Approval from the institutional review boards of both participating institutions was obtained prior to the study. From the Children’s Hospital of New York (CHONY) in New York City, NY (a level 1 pediatric trauma center), we obtained 16 810 frontal view pediatric hand radiographs (from approximately 10 000 pediatric patients) obtained for trauma between December 14, 2009, and May 31, 2017. Of the radiographs, 41% were multiple radiographs in the same patient, either the same hand at a different timepoint or the contralateral hand at the same timepoint. Images were included only if a pediatric radiologist (R.S.A., with 6 years of experience) determined them to be satisfactory for bone age evaluation, excluding those with congenital anomalies, compromised image quality, and poor patient positioning. Ten percent of the data (n = 1681) were used as a holdout test set. The remaining data (n = 15 129), which we define to be the training set, were divided into four training (90%) and validation (10%) folds to train a fourfold ensemble. We also trained a RetinaNet object detection model (18) on 12 595 pediatric hand radiographs from the RSNA Pediatric Bone Age Machine Learning Challenge (16), which was used to crop and standardize images.
In addition, to demonstrate generalizability beyond the training data population, we obtained an independent test set from Hasbro Children’s Hospital (HCH) in Providence, RI (a level 1 pediatric trauma center) of 214 frontal view pediatric trauma hand radiographs from 213 patients, randomly selected from 1626 studies across 1481 patients that occurred between March 31, 2015, and July 3, 2018. Images were included only if a pediatric radiologist (R.S.A.) determined them to be satisfactory for bone age evaluation. Two board-certified pediatric radiologists (R.S.A. and D.W.S., each with 6 years of experience) independently assessed bone age using the GP method. The pediatric radiologists were blinded to the chronological age of the patients at the time of interpretation. In addition, bone age was assessed by a DL-BAAM trained on hand radiographs from the RSNA Pediatric Bone Age Machine Learning Challenge (which was a GP-based DL-BAAM [GPDL-BAAM]). Therefore, a balanced block design was used to evaluate bone age estimation for each DL-BAAM and radiologist (ie, all cases were read by the TDL-BAAM, GPDL-BAAM, and radiologists).
Bone Age Assessment Model Training
Models were trained using the PyTorch 1.4 deep learning toolkit (https://pytorch.org) (19) in the Python programming language, version 3.7 (Python Software Foundation, Wilmington, Del; https://www.python.org/). Each DL-BAAM was an ensemble of four convolutional neural networks. We trained a DenseNet121 (20) ensemble based on solutions from the RSNA Pediatric Bone Age Machine Learning Challenge. Both the TDL-BAAM and GPDL-BAAM were developed using the same methods. Briefly, for each of the two DL-BAAMs, two of four neural networks were trained using square patches cropped from the original image, whereas the other two neural networks were trained on whole images. In all four neural networks, the output of a sex-embedding layer was concatenated to the final feature vector to predict the scalar bone age. A simple average of the individual model predictions was used as the final prediction. To combat bias toward age groups with more training data, we conducted two additional experiments using a balanced loss function which weights the loss contribution of a sample by the inverse of its age group frequency in the training data and a balanced sampling technique which constructs the training set for each epoch by sampling an equal number of cases from each age group. Full technical details are available in Appendix E1 (supplement). All source code and models are publicly available at https://github.com/i-pan/boneage.
Statistical Analysis
The CHONY test set was used to compare TDL-BAAM and GPDL-BAAM. A more comprehensive analysis was performed on the independent test set from HCH, which was used to evaluate and compare performance of the TDL-BAAM with the GPDL-BAAM and two pediatric radiologists (R.S.A. and D.W.S.). Performance for each rater was evaluated using the mean absolute error (MAE) and the percentages of bone age predictions within 12, 18, and 24 months of chronological age. Statistical significance, defined as P less than .05, was determined using nonparametric permutation tests and the bootstrap method conducted via simulation in Python 3.7. The McNemar test was used to determine the statistical significance for percentages of bone age predictions within 12, 18, and 24 months (I.P., 3 years of experience).
The evaluation of bone age prediction is best described as evaluation of bone morphology. Although the TDL-BAAM training used chronological age as the ground truth on the trauma hand radiographs, the relationship between bone morphology and chronological age is stochastic. Given this background, we conducted standard concordance analyses to quantify the relationships among both DL-BAAMs, radiologists, and chronological age, using intraclass correlation coefficients with random effects, Bland-Altman analysis, and Deming regression (Appendix E2 [supplement]). To compare prediction values among all methods, we performed generalized mixed modeling with sandwich estimation where observations were nested within patients. Concordance measures were performed using mrc, methods, and blandr packages in R (R Foundation for Statistical Computing, Vienna, Austria; https://www.R-project.org), and generalized mixed modeling was performed using SAS Software 9.4 (SAS Institute, Cary, NC) (G.L.B, 8 years of experience).
Results
Dataset Characteristics
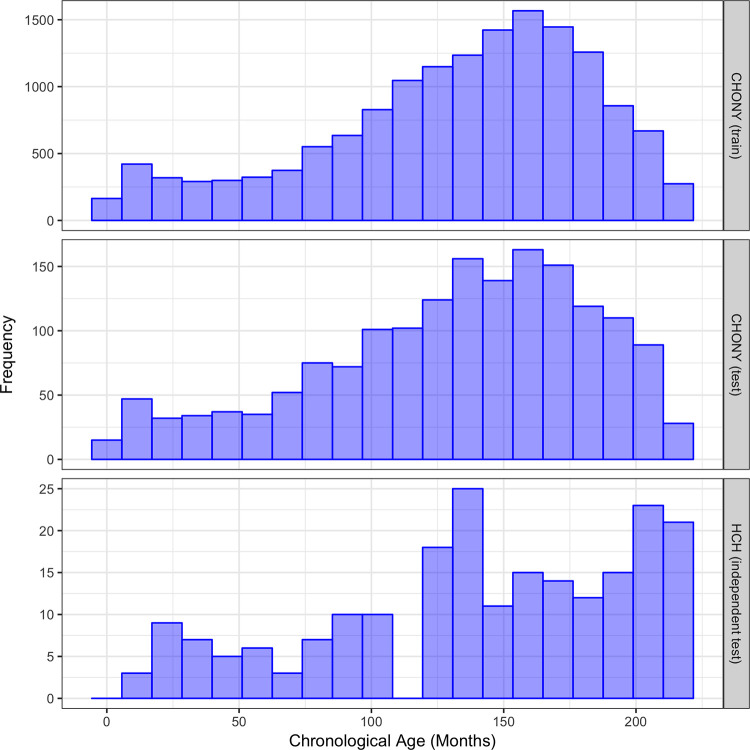
The CHONY training set consisted of radiographs from 7633 (50.5%) male patients and 7496 (49.5%) female patients, with an age range of 0–18 years and mean age of 11.0 years. The CHONY test set comprised 848 (50.4%) males and 833 (49.6%) females, with an age range of 0–18 years and mean age of 10.9 years. The HCH test set comprised 100 (46.7%) males and 114 (53.3%) females with an age range of 1–18 years and mean age of 11.7 years. The distributions of ages for these datasets are shown in Figure 1.
Figure 1:
Distribution of chronological age in Children’s Hospital of New York (CHONY) training set (top), CHONY test set (middle), and Hasbro Children’s Hospital (HCH) (bottom).
At the time of this study, demographic information, including race and ethnicity, were not consistently available in the electronic medical record at CHONY. Similarly, race and ethnicity were not easily accessible at HCH, as this information is not directly linked to the imaging study. We extrapolated the diversity of our populations from the populations of the surrounding neighborhoods by using data from the 2010 census. For CHONY, the demographic breakdown of the surrounding Washington Heights neighborhood was 70.6% Hispanic (of any race), 17.7% non-Hispanic White, 7.6% non-Hispanic Black, and 2.6% Asian (21). For HCH, the demographic breakdown of Providence County was 73.4% White, 8.5% Black, 3.7% Asian, with 18.8% Hispanic (22).
Metrics Evaluation
For CHONY, the MAEs of the TDL-BAAM and GPDL-BAAM were 7.4 and 12.9 (P < .0001) months, respectively. The percentages of bone age predictions within 12 months for TDL-BAAM and GPDL-BAAM were 80.7% and 55.5% (P < .0001), within 18 months were 93.1% and 73.4% (P < .0001), and within 24 months were 98.3% and 86.4% (P < .0001), respectively.
For HCH, the MAEs of the TDL-BAAM, GPDL-BAAM, radiologist 1, and radiologist 2 were 11.1, 12.9 (P = .0005), 14.6 (P < .0001), and 16.0 (P < .0001) months, respectively. The percentages of bone age predictions within 12 months were 73.4%, 66.4% (P = .023), 67.8% (P = .048), and 60.7% (P = .0001), respectively; within 18 months were 86.9%, 79.9% (P = .020), 70.1% (P < .0001), and 65.0% (P < .0001); and within 24 months were 95.3%, 91.6% (P = .096), 86.0% (P < .0001), and 84.6% (P < .0001).
Intraclass Correlation Coefficients
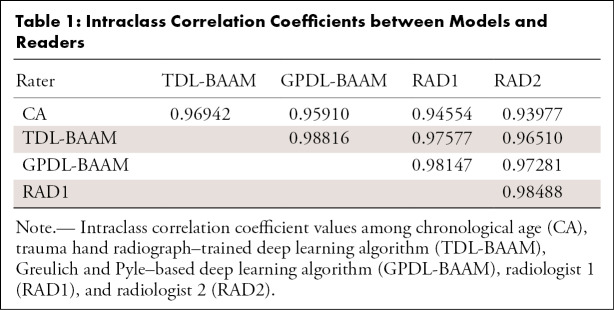
As indicated in Table 1, concordance was high among the TDL-BAAM, GPDL-BAAM, radiologists, and chronological age (all intraclass correlation coefficients > 0.93). These analyses indicate that 2%–7% of the variability of bone age prediction is due to differences between raters, which are visualized using the Deming regressions and Bland-Altman analyses.
Table 1:
Intraclass Correlation Coefficients between Models and Readers
Deming Regression
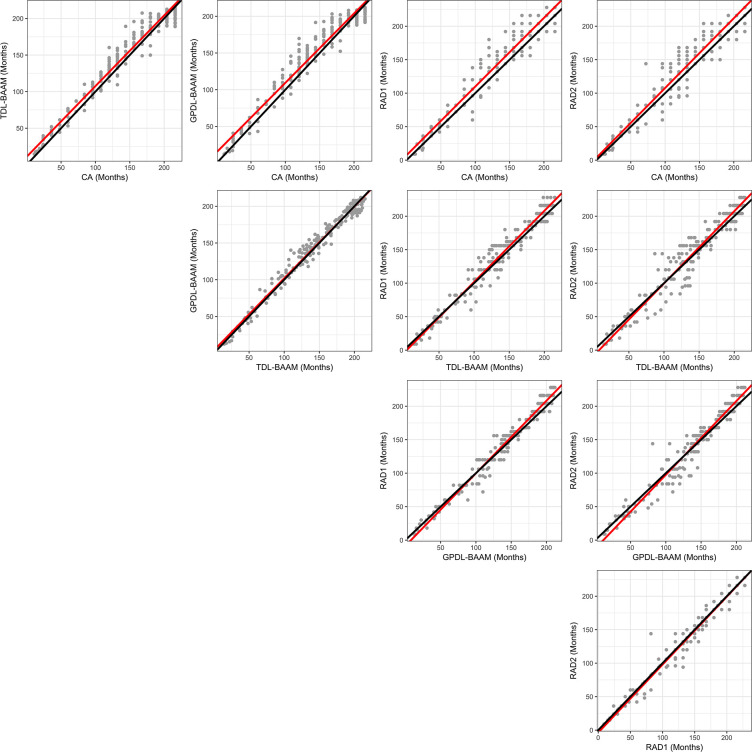
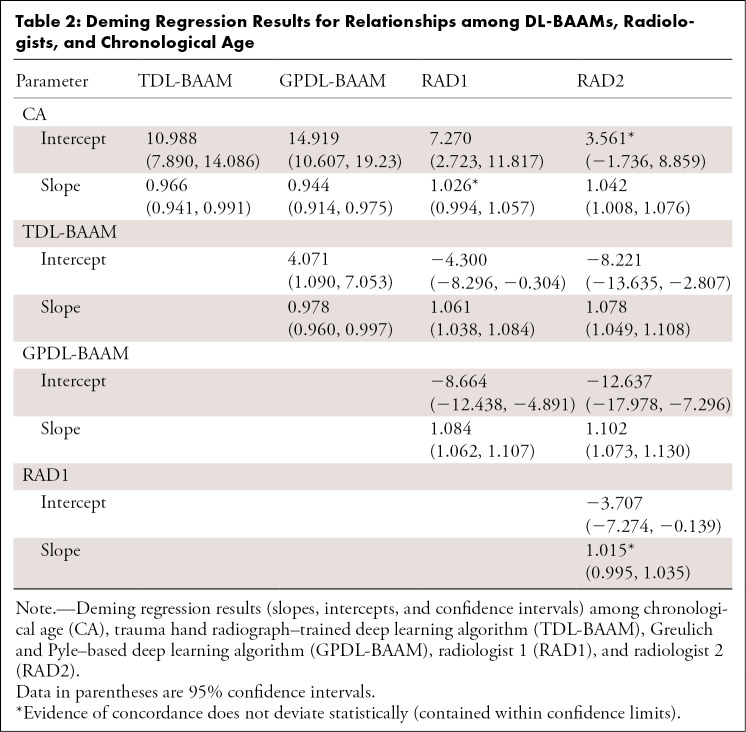
As indicated in Figure 2, concordance among the TDL-BAAM, GPDL-BAAM, radiologists, and chronological age appears good upon visual inspection, though evidence exists for systematic differences among raters and chronological age, which is indicated in Table 2. Both the TDL-BAAM and GPDL-BAAM predicted higher bone age than chronological age for earlier years, as evidenced by the slopes deviating from 1. The radiologists achieved better concordance with chronological age: For radiologist 1, the intercept was slightly higher, while the slope was concordant with chronological age. Conversely, the intercept for radiologist 2 was concordant with chronological age, but the slope was slightly higher. Note that chronological age is not a true predictor of bone age (ie, chronological age can only be used to evaluate if a child’s bone morphology is within a normal range), thus these relationships are not directly interpretable.
Figure 2:
Deming regression comparisons among chronological age (CA), trauma hand radiograph–trained deep learning algorithm (TDL-BAAM), Greulich and Pyle–based deep learning algorithm (GPDL-BAAM), radiologist 1 (RAD1), and radiologist 2 (RAD2). Perfect concordance is represented by a 45-degree line (black line), and the observed concordance is represented by the Deming regression slope (red line)
Table 2:
Deming Regression Results for Relationships among DL-BAAMs, Radiologists, and Chronological Age
The TDL-BAAM and GPDL-BAAM demonstrate good concordance with each other, though the GPDL-BAAM tended to produce higher predictions than the TDL-BAAM. Evidence of good concordance was demonstrated between the two radiologists, with the slope encompassing 1. Larger differences existed between the radiologists and the TDL-BAAM and GPDL-BAAM. For both radiologists and both DL-BAAMs, the TDL-BAAM predictions were systematically higher than what the radiologists predicted for younger ages (approximately 3 to 100 months). For older ages (approximately 101 to 200 months), the two DL-BAAM predictions were systematically lower than those of the radiologists. Despite consistent systematic differences, all of these differences are relatively small, as indicated in Figure 2.
Bland-Altman Analysis
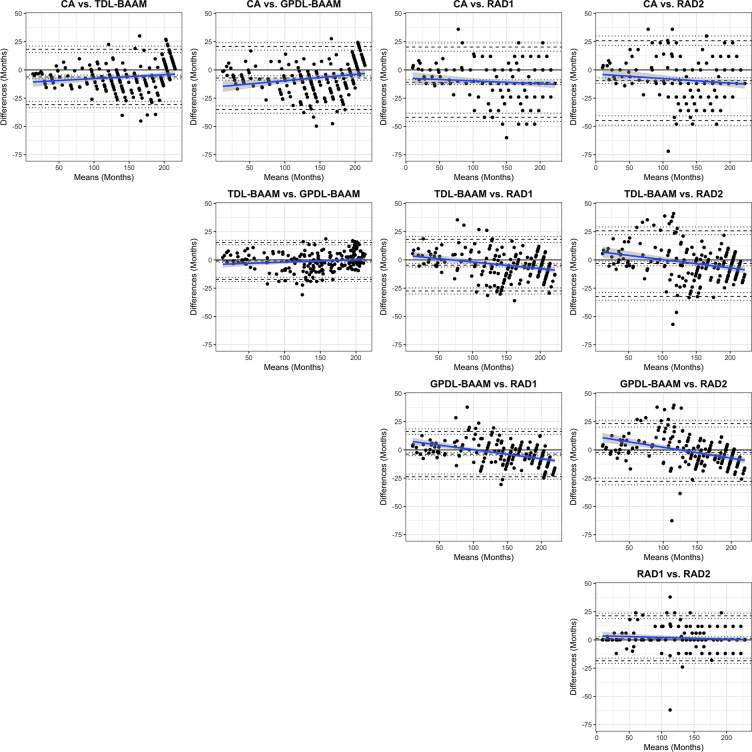
As seen in Table 3 and Figure 3, both DL-BAAMs and both radiologists predicted higher bone age than chronological age. Differences between DL-BAAM predictions and chronological age decreased as age increased. Conversely, a systematic trend failed to be observed between radiologists and chronological age, though a mean bias was present: The predictions of radiologists 1 and 2 were 11 and 10 months higher, respectively, than chronological age.
Table 3:
Bland-Altman Results for Relationships among DL-BAAMs, Radiologists, and Chronological Age
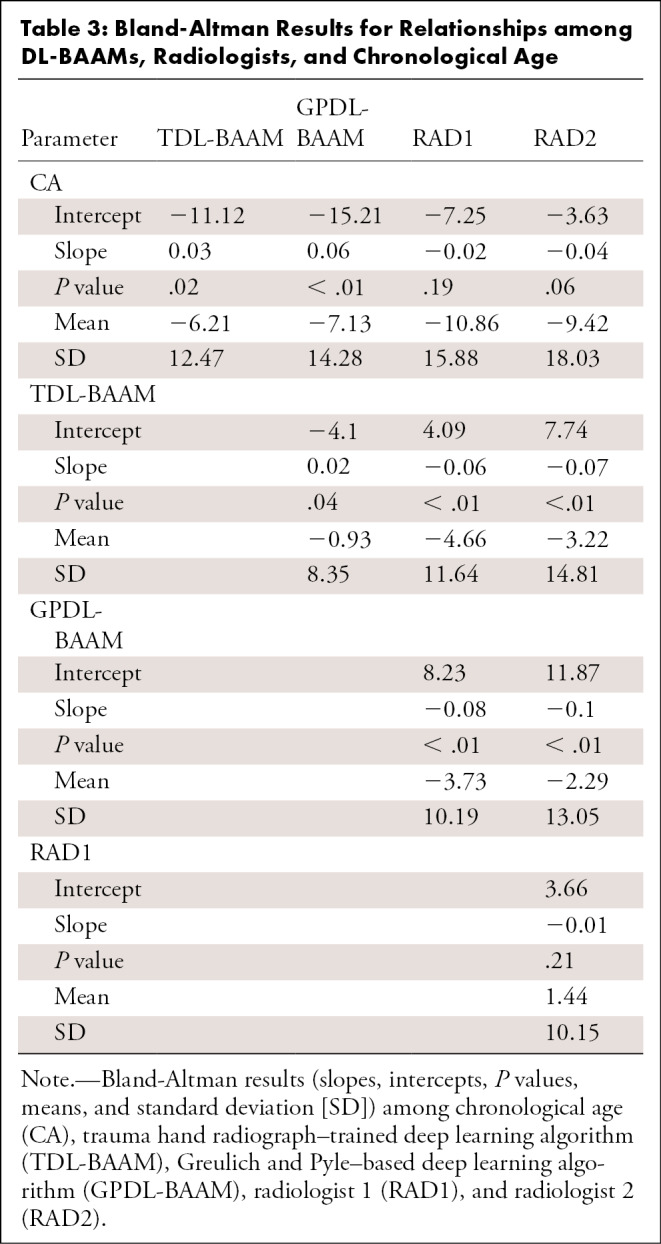
Figure 3:
Bland-Altman comparisons among chronological age (CA), trauma hand radiograph–trained deep learning algorithm (TDL-BAAM), Greulich and Pyle–based deep learning algorithm (GPDL-BAAM), radiologist 1 (RAD1), and radiologist 2 (RAD2). The center dashed line represents the observed mean difference. The top and bottom dashed lines denote 1.96 standard deviations above and below the mean difference. The dotted line represents 95% confidence intervals for these three values. A black line at 0 is the reference representing no bias (mean or slope) exists. The blue line represents the estimated bias from 0 with respect to age with 95% confidence intervals (gray shaded area).
The concordance between the two DL-BAAMs was excellent, despite being trained on separate datasets. Concordance between radiologists was also excellent: Radiologist 1’s bone age prediction was, on average, 1.4 months higher than radiologist 2’s prediction. Systematic trend differences were found between the DL-BAAMs and radiologists. Radiologists’ bone age predictions were lower than the DL-BAAMs’ predictions for younger children; however, as chronological age increased, radiologists’ bone age predictions were higher than the DL-BAAMs’ predictions (Fig 3).
Differences among Raters
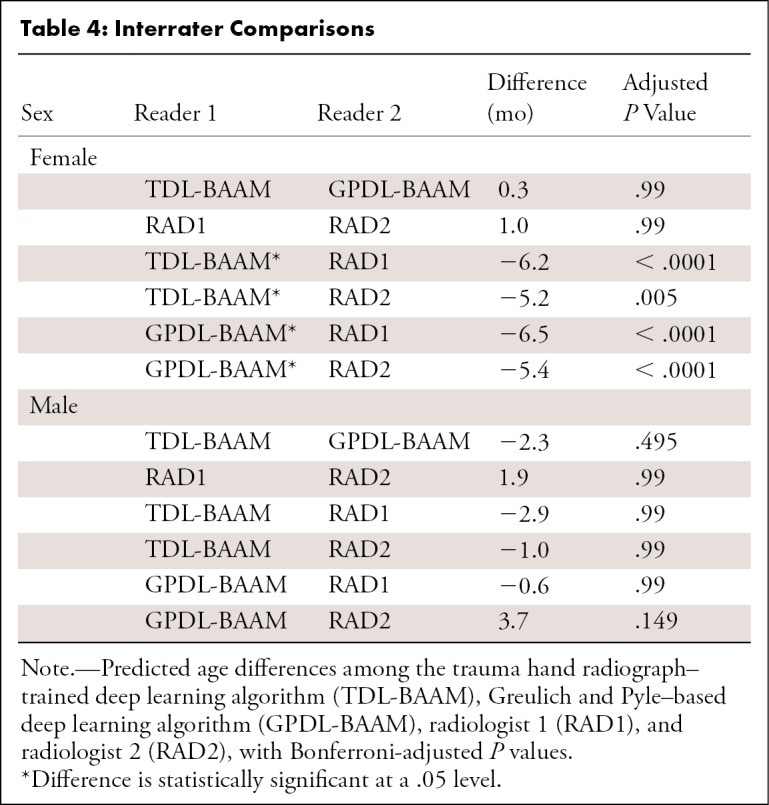
Figure 4 and Table 4 illustrate the mean differences among all DL-BAAMs and radiologists. For assessment of male bone age, we did not observe differences between readers. For assessment of female bone age, differences were observed between the two DL-BAAMs and two radiologists: Radiologists’ predictions were on average higher than DL-BAAM predictions by 5–7 months.
Figure 4:
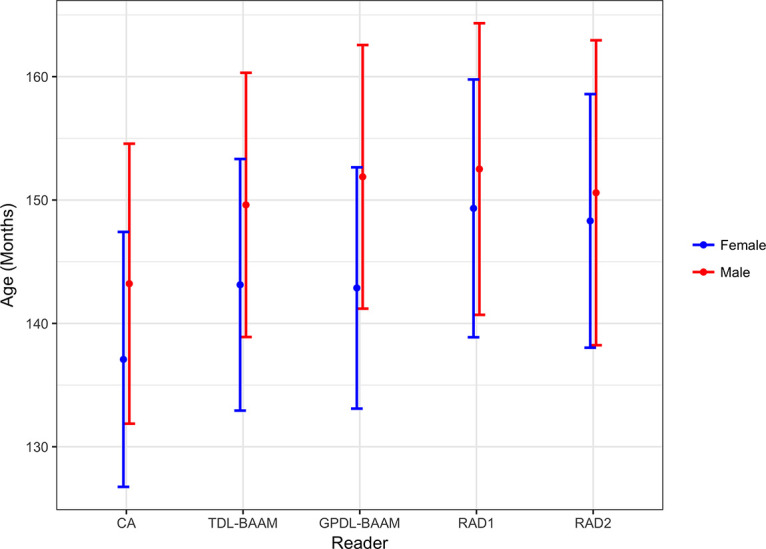
Predicted bone age in months (y-axis) by chronological age (CA), trauma hand radiograph–trained deep learning algorithm (TDL-BAAM), Greulich and Pyle–based deep learning algorithm (GPDL-BAAM), radiologist 1 (RAD1), and radiologist 2 (RAD2) between male and female patients with 95% confidence intervals.
Table 4:
Interrater Comparisons
Balancing Experiments
Our two experiments were performed in an attempt to correct systematic bias potentially due to an imbalanced training set, using a balanced loss function and balanced sampling, and showed similar results to those in the unbalanced setting. Balancing techniques resulted in small, systematic differences in model predictions between balanced and unbalanced models (Bland-Altman: slope =−0.01, P = .04 [vs balanced loss]; slope = 0.01, P < .01 [vs balanced sampling] for TDL-BAAM and slope = −0.02, P < .01 [vs balanced loss]; slope = −0.02, P < .01 [vs balanced sampling] for GPDL-BAAM). However, these differences did not result in any statistically significant changes in concordance of the DL-BAAMs with chronological age, and systematic biases persisted when comparing deep learning models, chronological age, and radiologists. Complete results are presented in Tables E1–E3 and Figures E1–E4 (supplement).
Discussion
In this study, we developed a deep learning model for bone age assessment by training a convolutional neural network to predict bone age based on morphology using pediatric hand radiographs acquired for traumatic indications, knowing only the children’s sex and chronological age without radiologist clinical interpretation. We then compared the concordance of our TDL-BAAM with GPDL-BAAM along with two pediatric radiologists who used the standard GP method.
Prior studies evaluating automated bone age assessment used reference standards determined by the GP method, either accrued from clinical reports, interpretations from independent reviewers, or both (13,17,23). Our study differs from prior studies in that our assessment method, TDL-BAAM, was developed independent of any reference to GP, utilizing normal bone morphology based on pediatric trauma hand radiographs. We then compared this method with GP-based methods. The GP atlas was developed in the 1950s on a relatively homogeneous cohort of White children in Cleveland, Ohio. The generalizability to other populations remains indeterminate, with several studies suggesting suboptimal accuracy in children with different demographic characteristics (24–27). The current United States pediatric population differs substantially given variations in ethnicity, geography, and other environmental factors such as socioeconomic status and nutrition. Our study attempted to incorporate this variation within the modern pediatric population by developing a deep learning model for bone age assessment utilizing chronological age, rather than GP-assigned bone ages, as a training standard to predict bone age. To the knowledge of the authors, this is the first deep learning model for bone age assessment of its kind to be described in the literature.
We found good concordance among chronological age and all DL-BAAMs and radiologists. We did observe that the TDL-BAAM and GPDL-BAAM were more prone to systematic biases than radiologists: The DL-BAAMs tended to overpredict age for younger children, and this tendency decreased for older children. Meanwhile, radiologists predicted with a consistent mean bias regardless of age. The DL-BAAMs are sensitive to the distribution of the training set, which typically is predominantly composed of children in the peripubertal period of development, with smaller cohorts of patients in the younger and older age groups, a challenge seen also in prior studies (17). Some authors have even chosen to exclude younger age groups from their analysis (13). One of the main indications for bone age evaluation in children is delayed or precocious puberty, a diagnosis typically made in the peripubertal period (1,2); therefore, there is a paucity of data in the extreme age ranges of less than 5 years and greater than 14 years.
Similar to previous studies, we used independent interpretations by experienced pediatric radiologists as a reference standard to compare against the DL-BAAMs. The pediatric radiologists were blinded to the chronological age during the interpretation and used the GP method to assign bone ages. Prior studies have reported MAEs to compare automated tools in predicting bone age to radiologists (17,23). Of note, the MAEs we report are substantially higher than those of prior studies using GP bone ages as ground truth. We believe this is attributed to greater variability in bone morphology within a given chronological age group than within a given GP bone age group; for example, 12-year-old children have greater variability in bone morphology than children with GP bone ages of 12 years. This increased variability directly increases the MAE. In addition to MAE, we evaluated bone age predictions using standard concordance measures typically used when comparing radiologists to each other (ie, Bland-Altman and Deming regression), as reported in some prior studies (11). While we found evidence for good concordance in general (ie, high intraclass correlation coefficients), we also found evidence for some systematic differences between the DL-BAAMs and radiologists. For example, both DL-BAAMs’ predictions were higher than both radiologists’ predictions for younger children; in older children, this trend was reversed, with the DL-BAAMs’ predictions being lower than the radiologists’. Concordance between DL-BAAMs was high, and concordance between radiologists was high for all age groups. Thus, there appear to be systematic differences, though relatively small, in predictions from DL-BAAMs and radiologists.
A limitation of our study was the small cohort of patients that the TDL-BAAM was tested on. This may have contributed to the results not being substantially different than the GPDL-BAAM or radiologists in evaluating trauma radiographs in this cohort. Although our results illustrated interesting systematic differences, future work developing and testing the TDL-BAAM on a larger sample of trauma radiographs across an equal number of age ranges can help further investigate our results. Another limitation was that our study trained and tested the TDL-BAAM on a sample of pediatric hand radiographs that were obtained for trauma in the emergent setting, and not for true bone age evaluation. This cohort was assumed to be clinically normal in comparison to the typical population of children who receive bone age evaluation. We assumed all patients in both training and test sets to be developmentally normal; however, this assumption is difficult to confirm, and it is likely some patients have abnormal studies. Nevertheless, a small proportion of abnormal studies would not be expected to have a large influence on the final model. In addition, abnormalities unrelated to skeletal development (fractures, bone lesions, etc) would be marginalized by the model as noise, and therefore should not have an effect on the overall model. Our study provides a foundation for developing deep learning–based approaches to bone age assessment that are more representative of today’s pediatric population and can be tailored to specific populations; however, further work is needed to investigate the use of the TDL-BAAM in a larger, contemporary patient population and with more patient-specific demographic information.
The results of our study show that our TDL-BAAM method has the potential to predict a child’s bone age; this prediction could easily be used, post hoc, to then compare with a child’s chronological age to determine if their bone morphology falls outside the normal range. One potential application of this tool in clinical practice is the ability to flag abnormal cases for review by radiologists. The implications of this change in methods may lend this tool to streamline clinical workflow and to be used as a quality assurance method.
APPENDIX
SUPPLEMENTAL FIGURES
Disclosures of Conflicts of Interest: I.P. Activities related to the present article: disclosed no relevant relationships. Activities not related to the present article: disclosed no relevant relationships. Other relationships: author is a consultant for MD.ai. G.L.B. disclosed no relevant relationships. S.M. disclosed no relevant relationships. D.M. disclosed no relevant relationships. C.R. disclosed no relevant relationships. D.W.S. disclosed no relevant relationships. R.S.A. disclosed no relevant relationships.
Abbreviations:
- CHONY
- Children’s Hospital of New York
- DL-BAAM
- deep learning bone age assessment method
- GP
- Greulich and Pyle
- GPDL-BAAM
- GP-based DL-BAAM
- HCH
- Hasbro Children’s Hospital
- MAE
- mean absolute error
- TDL-BAAM
- trauma hand radiograph–trained DL-BAAM
References
- 1.Martin DD, Wit JM, Hochberg Z, et al. The use of bone age in clinical practice - part 1. Horm Res Paediatr 2011;76(1):1–9. [DOI] [PubMed] [Google Scholar]
- 2.Martin DD, Wit JM, Hochberg Z, et al. The use of bone age in clinical practice - part 2. Horm Res Paediatr 2011;76(1):10–16. [DOI] [PubMed] [Google Scholar]
- 3.Breen MA, Tsai A, Stamm A, Kleinman PK. Bone age assessment practices in infants and older children among Society for Pediatric Radiology members. Pediatr Radiol 2016;46(9):1269–1274. [DOI] [PubMed] [Google Scholar]
- 4.Bull RK, Edwards PD, Kemp PM, Fry S, Hughes IA. Bone age assessment: a large scale comparison of the Greulich and Pyle, and Tanner and Whitehouse (TW2) methods. Arch Dis Child 1999;81(2):172–173. [DOI] [PMC free article] [PubMed] [Google Scholar]
- 5.Greulich W, Pyle S. Radiographic Atlas of Skeletal Development of the Hand and Wrist. Stanford, Calif: Stanford University Press, 1999. [Google Scholar]
- 6.Berst MJ, Dolan L, Bogdanowicz MM, Stevens MA, Chow S, Brandser EA. Effect of knowledge of chronologic age on the variability of pediatric bone age determined using the Greulich and Pyle standards. AJR Am J Roentgenol 2001;176(2):507–510. [DOI] [PubMed] [Google Scholar]
- 7.Thodberg HH, Sävendahl L. Validation and reference values of automated bone age determination for four ethnicities. Acad Radiol 2010;17(11):1425–1432. [DOI] [PubMed] [Google Scholar]
- 8.Johnson GF, Dorst JP, Kuhn JP, Roche AF, Dávila GH. Reliability of skeletal age assessments. Am J Roentgenol Radium Ther Nucl Med 1973;118(2):320–327. [DOI] [PubMed] [Google Scholar]
- 9.Tong C, Liang B, Li J, Zheng Z. A Deep Automated Skeletal Bone Age Assessment Model with Heterogeneous Features Learning. J Med Syst 2018;42(12):249. [DOI] [PubMed] [Google Scholar]
- 10.Dallora AL, Anderberg P, Kvist O, Mendes E, Diaz Ruiz S, Sanmartin Berglund J. Bone age assessment with various machine learning techniques: A systematic literature review and meta-analysis. PLoS One 2019;14(7):e0220242. [DOI] [PMC free article] [PubMed] [Google Scholar]
- 11.Kim JR, Shim WH, Yoon HM, et al. Computerized Bone Age Estimation Using Deep Learning Based Program: Evaluation of the Accuracy and Efficiency. AJR Am J Roentgenol 2017;209(6):1374–1380. [DOI] [PubMed] [Google Scholar]
- 12.Spampinato C, Palazzo S, Giordano D, Aldinucci M, Leonardi R. Deep learning for automated skeletal bone age assessment in X-ray images. Med Image Anal 2017;36:41–51. [DOI] [PubMed] [Google Scholar]
- 13.Lee H, Tajmir S, Lee J, et al. Fully Automated Deep Learning System for Bone Age Assessment. J Digit Imaging 2017;30(4):427–441. [DOI] [PMC free article] [PubMed] [Google Scholar]
- 14.Thodberg HH, Kreiborg S, Juul A, Pedersen KD. The BoneXpert method for automated determination of skeletal maturity. IEEE Trans Med Imaging 2009;28(1):52–66. [DOI] [PubMed] [Google Scholar]
- 15.Mutasa S, Chang PD, Ruzal-Shapiro C, Ayyala R. MABAL: a Novel Deep-Learning Architecture for Machine-Assisted Bone Age Labeling. J Digit Imaging 2018;31(4):513–519. [DOI] [PMC free article] [PubMed] [Google Scholar]
- 16.Halabi SS, Prevedello LM, Kalpathy-Cramer J, et al. The RSNA Pediatric Bone Age Machine Learning Challenge. Radiology 2019;290(2):498–503. [DOI] [PMC free article] [PubMed] [Google Scholar]
- 17.Larson DB, Chen MC, Lungren MP, Halabi SS, Stence NV, Langlotz CP. Performance of a deep-learning neural network model in assessing skeletal maturity on pediatric hand radiographs. Radiology 2018;287(1):313–322. [DOI] [PubMed] [Google Scholar]
- 18.Lin T, Goyal P, Girshick R, He K, Dollár P. Focal Loss for Dense Object Detection. arXiv: 1708.02002 [preprint]. https://arxiv.org/abs/1708.02002. Posted August 7, 2017. Accessed November 1, 2019. [DOI] [PubMed] [Google Scholar]
- 19.Paszke A, Gross S, Chintala S, et al. Automatic Differentiation in PyTorch. In: NIPS Autodiff Workshop, 2017. [Google Scholar]
- 20.Huang G, Liu Z, van der Maaten L, Weinberger KQ. Densely Connected Convolutional Networks. arXiv: 1608.06993 [preprint]. https://arxiv.org/abs/1608.06993. Posted August 25, 2016. Accessed November 1, 2019. [Google Scholar]
- 21.Table PL-P3A NTA: Total Population by Mutually Exclusive Race and Hispanic Origin, New York Neighborhood Tabulation Areas , 2010. City of New York Web site. https://www1.nyc.gov/assets/planning/download/pdf/data-maps/nyc-population/census2010/t_pl_p3a_nta.pdf. Published March 29, 2011. Accessed February 1, 2019.
- 22.Rhode Island Race & Ethnic Origin Demographics by County, 2000-2010. Rhode Island Department of Labor and Training Web site. https://dlt.ri.gov/documents/pdf/lmi/ethnic.pdf. Accessed February 1, 2019.
- 23.Tajmir SH, Lee H, Shailam R, et al. Artificial intelligence-assisted interpretation of bone age radiographs improves accuracy and decreases variability. Skeletal Radiol 2019;48(2):275–283. [DOI] [PubMed] [Google Scholar]
- 24.Tsehay B, Afework M, Mesifin M. Assessment of Reliability of Greulich and Pyle (GP) Method for Determination of Age of Children at Debre Markos Referral Hospital, East Gojjam Zone. Ethiop J Health Sci 2017;27(6):631–640. [DOI] [PMC free article] [PubMed] [Google Scholar]
- 25.Mohammed RB, Rao DS, Goud AS, Sailaja S, Thetay AAR, Gopalakrishnan M. Is Greulich and Pyle standards of skeletal maturation applicable for age estimation in South Indian Andhra children? J Pharm Bioallied Sci 2015;7(3):218–225. [DOI] [PMC free article] [PubMed] [Google Scholar]
- 26.Alshamrani K, Messina F, Offiah AC. Is the Greulich and Pyle atlas applicable to all ethnicities? A systematic review and meta-analysis. Eur Radiol 2019;29(6):2910–2923. [DOI] [PMC free article] [PubMed] [Google Scholar]
- 27.Zhang A, Sayre JW, Vachon L, Liu BJ, Huang HK. Racial differences in growth patterns of children assessed on the basis of bone age. Radiology 2009;250(1):228–235. [DOI] [PMC free article] [PubMed] [Google Scholar]
Associated Data
This section collects any data citations, data availability statements, or supplementary materials included in this article.


