. 2020 Jul 29;2(4):e190198. doi: 10.1148/ryai.2020190198

Figure 3:

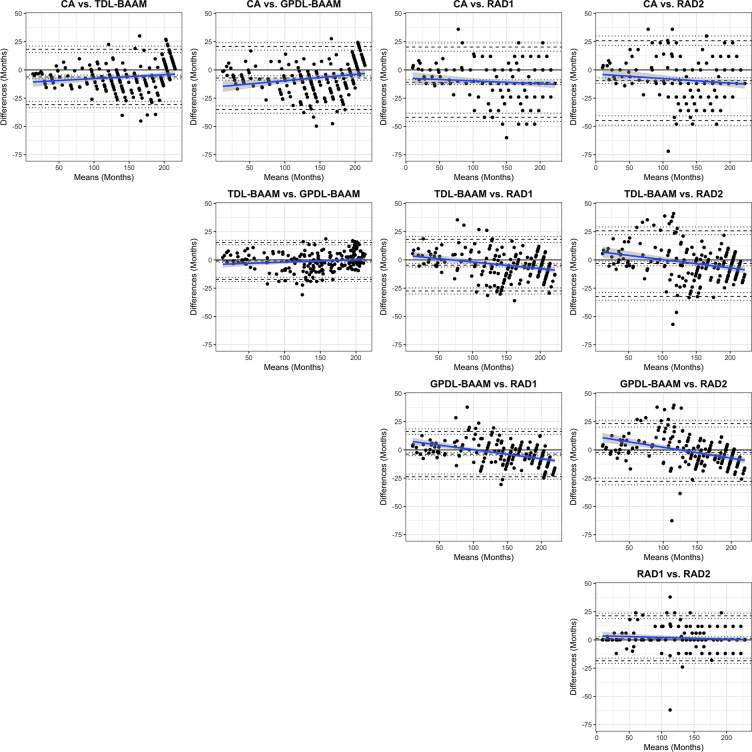
Bland-Altman comparisons among chronological age (CA), trauma hand radiograph–trained deep learning algorithm (TDL-BAAM), Greulich and Pyle–based deep learning algorithm (GPDL-BAAM), radiologist 1 (RAD1), and radiologist 2 (RAD2). The center dashed line represents the observed mean difference. The top and bottom dashed lines denote 1.96 standard deviations above and below the mean difference. The dotted line represents 95% confidence intervals for these three values. A black line at 0 is the reference representing no bias (mean or slope) exists. The blue line represents the estimated bias from 0 with respect to age with 95% confidence intervals (gray shaded area).

Bland-Altman comparisons among chronological age (CA), trauma hand radiograph–trained deep learning algorithm (TDL-BAAM), Greulich and Pyle–based deep learning algorithm (GPDL-BAAM), radiologist 1 (RAD1), and radiologist 2 (RAD2). The center dashed line represents the observed mean difference. The top and bottom dashed lines denote 1.96 standard deviations above and below the mean difference. The dotted line represents 95% confidence intervals for these three values. A black line at 0 is the reference representing no bias (mean or slope) exists. The blue line represents the estimated bias from 0 with respect to age with 95% confidence intervals (gray shaded area).