. 2020 May 27;2(3):e180063. doi: 10.1148/ryai.2020180063

Figure 4a:

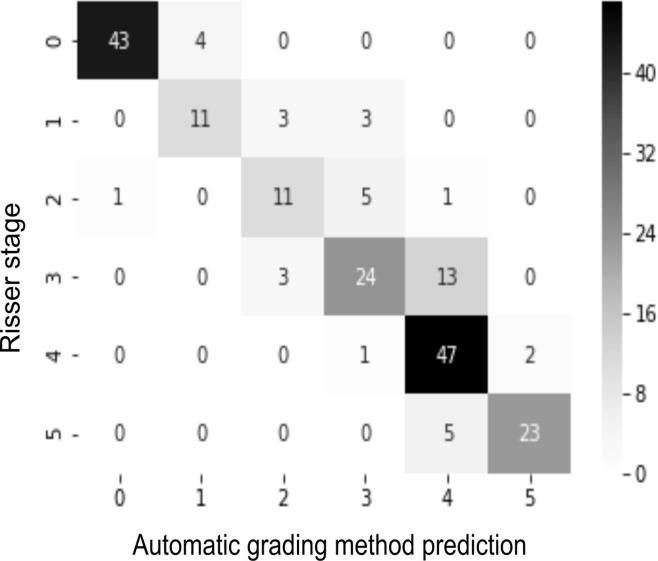
(a) Confusion matrix for the automatic grading method. (b) Confusion matrix for one of the observers. The rows of the matrix show the values indicated by the observer, while the columns show the ground truth. The values on the diagonal of the matrix illustrate the number of samples correctly classified by Risser grade. The values above and below each value of the diagonal show misclassified samples.

(a) Confusion matrix for the automatic grading method. (b) Confusion matrix for one of the observers. The rows of the matrix show the values indicated by the observer, while the columns show the ground truth. The values on the diagonal of the matrix illustrate the number of samples correctly classified by Risser grade. The values above and below each value of the diagonal show misclassified samples.