Abstract
Purpose
To develop a deep learning algorithm for the automatic assessment of the extent of systemic sclerosis (SSc)–related interstitial lung disease (ILD) on chest CT images.
Materials and Methods
This retrospective study included 208 patients with SSc (median age, 57 years; 167 women) evaluated between January 2009 and October 2017. A multicomponent deep neural network (AtlasNet) was trained on 6888 fully annotated CT images (80% for training and 20% for validation) from 17 patients with no, mild, or severe lung disease. The model was tested on a dataset of 400 images from another 20 patients, independently partially annotated by three radiologist readers. The ILD contours from the three readers and the deep learning neural network were compared by using the Dice similarity coefficient (DSC). The correlation between disease extent obtained from the deep learning algorithm and that obtained by using pulmonary function tests (PFTs) was then evaluated in the remaining 171 patients and in an external validation dataset of 31 patients based on the analysis of all slices of the chest CT scan. The Spearman rank correlation coefficient (ρ) was calculated to evaluate the correlation between disease extent and PFT results.
Results
The median DSCs between the readers and the deep learning ILD contours ranged from 0.74 to 0.75, whereas the median DSCs between contours from radiologists ranged from 0.68 to 0.71. The disease extent obtained from the algorithm, by analyzing the whole CT scan, correlated with the diffusion lung capacity for carbon monoxide, total lung capacity, and forced vital capacity (ρ = −0.76, −0.70, and −0.62, respectively; P < .001 for all) in the dataset for the correlation with PFT results. The disease extents correlated with diffusion lung capacity for carbon monoxide, total lung capacity, and forced vital capacity were ρ = −0.65, −0.70, and −0.57, respectively, in the external validation dataset (P < .001 for all).
Conclusion
The developed algorithm performed similarly to radiologists for disease-extent contouring, which correlated with pulmonary function to assess CT images from patients with SSc-related ILD.
Supplemental material is available for this article.
© RSNA, 2020
Summary
The reported deep learning–based method can be used to evaluate the extent of interstitial lung disease in systemic sclerosis with results comparable to those of radiologists.
Key Points
■ The developed algorithm performs equally to radiologists for contouring disease extent on chest CT images; the Dice similarity coefficient ranged from 0.74 to 0.75 between the algorithm and radiologists compared with 0.68–0.71 between radiologists.
■ The disease extent calculated by the algorithm correlates well with pulmonary function (ρ = −0.76 for correlation with diffusion lung capacity for carbon monoxide; P < .001).
Introduction
Systemic sclerosis (SSc) is a rare systemic autoimmune disease predominantly found in women (3:1) with an incidence of 0.3–2.8 per 100 000 people per year (1). SSc is characterized by fibrosis and vascular remodeling of the skin and many visceral organs and is categorized as limited or diffuse depending on the extent of skin involvement (2). Among visceral organs, pulmonary involvement represents the leading cause of mortality (3,4). The prevalence of interstitial lung disease (ILD) is significantly higher in patients with diffuse SSc (5), and some of these patients may not be symptomatic. In the European League Against Rheumatism (EULAR) Scleroderma Trials and Research (EUSTAR) cohort of more than 7600 patients, 53% of patients had lung fibrosis at CT, whereas only 35% presented with dyspnea (5). Disease extent on CT images has been identified as an independent predictor of disease progression and mortality in patients with SSc (6,7). Quantification of ILD extent is also needed for treatment initiation and evaluation of its efficacy (8). Evaluation of disease extent cannot rely on pulmonary function tests (PFTs) alone because there are causes of functional impairment other than progression of disease extent such as infection or development of pulmonary hypertension.
A simple staging system that differentiates between limited and extensive ILD was proposed by Goh et al (6) on the basis of the combination of visual CT evaluations and measurements of forced vital capacity. The distinction between limited and extensive disease is based on whether the extent of ILD is visually greater than 20% of lung volume. A more precise visual assessment of ILD extent is difficult to obtain in clinical practice, and the development of automated quantitative methods could be of substantial clinical relevance and interest. Furthermore, automated methods could overcome the reported interobserver variability in the visual assessment of ILD extent (9,10).
Advances in artificial intelligence have led to the development of prospective imaging biomarkers to provide new indexes for patient care (11). Deep learning has become a major topic of interest over the past decade in this field because it can be used to develop automated methods for time-consuming or repetitive classification tasks. Deep convolutional neural networks and their variants have become the most frequently adopted methods for medical analysis (12,13). Unlike classic machine learning approaches that use hand-crafted features, deep convolutional neural networks learn directly and select features from the training data to optimize their output, with respect to the considered classification task. However, deep convolutional neural networks are sensitive to data variability and require large datasets for training. A major issue for the development of clinically valid algorithms is the lack of annotated images from routine clinical CT examinations. To the best of our knowledge, the largest publicly available annotated ILD dataset only contains partially annotated noncontiguous CT slices (3238 images) from 13 different ILDs (14).
Therefore, the goal of our study was to develop a robust deep learning–based quantification tool trained from a fully annotated dataset of contiguous CT images of the same ILD, allowing for automated quantification of ILD extent in patients with SSc. Adaptation of such a tool within the clinic could be used to help improve staging of patients with SSc-related ILDs.
Materials and Methods
Study Design and Participants
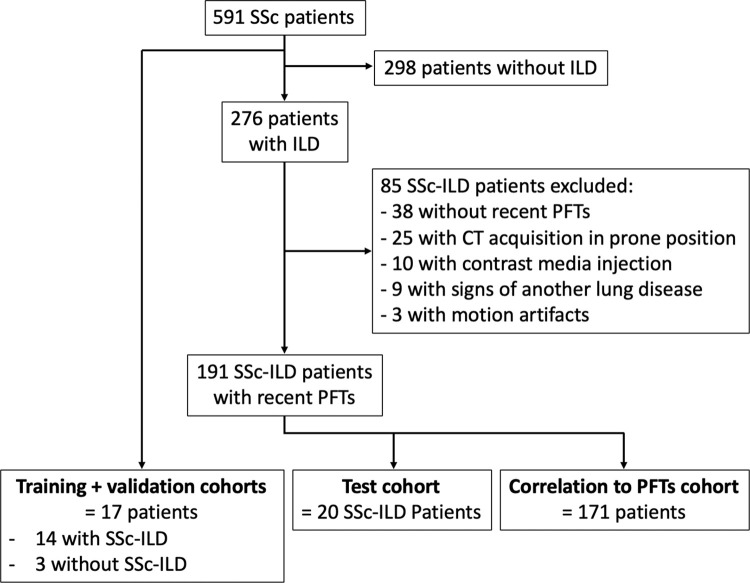
This single-center, retrospective study was approved by the institutional review board of the Société de Pneumologie de Langue Française (Comité d’évaluation des protocoles de recherche observationnels [CEPRO]–2017-023), which waived the need for patient consent. Patients who met the American College of Rheumatology and EULAR 2013 criteria for SSc (15) were recruited from the database of the Reference Center for Rare Systemic Autoimmune Diseases of Ile de France. Between January 2009 and October 2017, 591 patients from this reference center underwent chest CT. A total of 17 of these patients were selected for a training and validation dataset. This dataset included 6888 thin-section axial CT images in three patients without SSc ILD and 14 patients with SSc ILD of various degrees of severity.
CT images of the other 574 patients were reviewed for features typically found in SSc ILD, including ground-glass opacities, reticulations, traction bronchiectasis, and/or bronchiolectases, with or without honeycombing in a predominantly subpleural location. Exclusion criteria included motion artifacts, signs of lung disease other than SSc ILD, acquisitions in the prone position, contrast media injection, and unavailability of complete PFT measurement within 3 months before or after CT. Of the 191 patients included in the final dataset, 20 patients were randomly assigned to compose a test dataset. Images of the patients from the training and validation and test datasets (training dataset, 17 patients; test dataset, 20 patients; total, 37 patients) were previously used to develop a preliminary version of the deep learning algorithm used in this study. The correlation between PFT results and ILD extent assessed by deep learning was evaluated for the other 171 patients, referred to as the correlation-with-PFTs dataset (Fig 1).
Figure 1:
Flowchart of patient cohort. ILD = interstitial lung disease, PFT = pulmonary function test, SSc = systemic sclerosis.
An external validation dataset (31 patients) was composed of patients with scleroderma from another institution (Hôpital Saint-Antoine, Paris) who were evaluated between March 2009 and March 2014. The same inclusion and exclusion criteria were used.
For all patients, PFT measurements obtained within 3 months of chest CT were retrieved from the patients’ charts. They included the percentage of predicted forced vital capacity, total lung capacity, diffusion lung capacity for carbon monoxide, and carbon monoxide transfer coefficient, and the last two corrected for measured hemoglobin.
CT Examinations
At our institution, whole-lung CT examinations were performed with four different CT scanners with 16–128 multi–detector rows from two different manufacturers (Somatom Sensation 16, Somatom DS, and Somatom AS+, Siemens Healthineers, Erlangen, Germany; and Revolution HD, GE Healthcare, Milwaukee, Wis) by using nonstandardized acquisition parameters (tube voltage, 100 or 120 kVp, tube current modulation). Images were reconstructed with a slice thickness of 0.625–1.5 mm by using filter back projection or iterative reconstruction algorithms and a high-frequency kernel (Lung, B70f or I70F). In the three datasets, the majority of CT examinations had been performed with Siemens equipment (three of 17 in the training dataset, four of 20 in the validation dataset, and 25 of 171 in the correlation-with-PFTs dataset).
For the external validation dataset, CT examinations were performed by using a different multi–detector row CT scanner (Somatom Sensation 64; Siemens Healthineers) and nonstandardized acquisition parameters. Images were reconstructed with a slice thickness of 1.5 mm by using filter back projection only and a high-frequency kernel (B60f) different from that used at our institution.
Image Assessment and Annotation
Images from the original 591 patients were assessed by two radiologists (M.P.R. and G.A., with 18 and 19 years of experience in chest imaging, respectively) to determine which patient cases to include or exclude. A total of 191 patients were included in the final assessment (data from 20 patients were used for testing and data from the other 171 were used to assess the correlation of PFT results with ILD extent). In the training and test datasets, lung segmentations were performed with software (Myrian XP-Lung version 1.19.1; Intrasense, Montpellier, France) and manually corrected by one radiologist (G.C., with 4 years of experience in chest imaging).
Disease segmentation was performed by manually outlining the extent of ILD on axial CT images, including all anomalies, such as ground-glass opacities, reticulations, traction bronchiectasis, and honeycombing, with no attempt to separately outline each class of anomaly. CT images in the training dataset were fully annotated (manually contoured on each CT image showing signs of ILD) by one radiologist (G.C.). To assess intraobserver variation of image annotation in the training dataset, 20 CT slices equally spaced from the lung apices to the right diaphragmatic dome were reannotated for each patient.
CT examinations in the test dataset were annotated by three independent radiologists with 1–4 years of experience in chest imaging (G.C., C.M., N.J.). Each of the readers manually annotated 20 CT slices equally spaced from the lung apices to the right diaphragmatic dome, representing a total of 400 annotated slices for each radiologist. In the training dataset, they contoured the whole ILD extent without separately accounting for each class of anomaly.
Deep Learning–based Algorithm
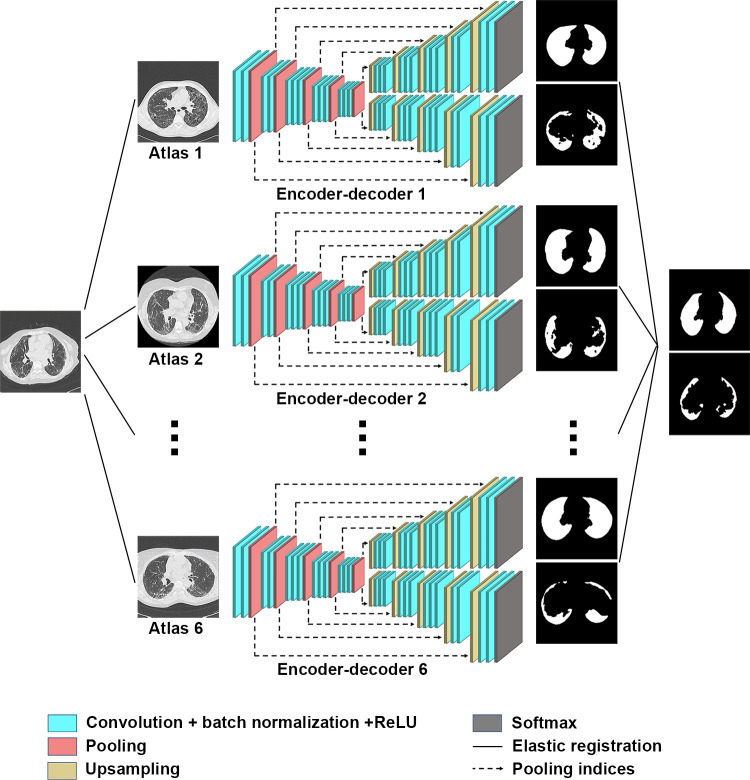
The model was developed in the training dataset by using a variant of AtlasNet (Center for Visual Computing, Ecole CentraleSupelec, Gif-sur-Yvette, France), a recently described multicomponent deep learning architecture (16). Briefly, the AtlasNet architecture trains a number of deep convolutional neural networks (n) and each of them uses a predefined anatomy on which all training patient cases are mapped through elastic registration, which results in a natural data augmentation. In this study, we augmented the AtlasNet network through a dual autodecoder architecture. This architecture choice was motivated by the need to guarantee anatomically plausible disease-segmentation results, which was achieved through the introduction of spatial interdependencies between lungs and disease classes, predicted by two different decoder parts. Our proposed architecture for this problem is based on a network similar to SegNet (Computer Vision and Robotics Group, University of Cambridge, Cambridge, England) (17), which is composed of one encoding part and two decoding branches: one for lung segmentation and the other one for disease segmentation. Five convolutional blocks are included, with each one containing two convolutional, batch-normalized, rectified-linear-unit layer successions. The first block increases the number of input channels to 64, whereas the rest of the blocks increase the channels to twice their size, resulting in 1024 planes at the end of the encoder. Max-pooling layers are also distributed at the end of each convolutional block except for the last one, bringing the input volumes down to one-fourth of their original resolution. Then the produced features are given as the input to two identical decoding branches, one responsible for detecting the disease category and the other responsible for detecting the lung category. Similar to the encoder, each decoding part involves convolutional blocks, but this time, upsampling layers are used instead of max-pooling layers to bring the feature vectors back to their original dimensions.
We used a loss function that optimized each decoder separately while at the same time applying semantic constraints, penalizing detections of the disease class that were not also detected within the lung class. In particular, each decoder optimized the weighted cross-entropy loss for each class as follows:
 |
and
 |
where K = {0, 1} for the classes of background and lung, respectively, and M = {0, 1} for the classes of background and disease, respectively. yl,k and yd,m are binary indicators for class labels k and m in the lung and disease decoders, respectively, whereas pl,k and pd,m are the predicted probability of classes k and m in the lung and disease decoders, respectively. Finally, ωk and ωm are the weights used for each class. For our experiments we used ωk = {1, 4} for the lung decoder and ωm = {1, 65} for the disease decoder.
Moreover, we integrated the semantic constraints, as follows:
 |
where pd,l is the predicted probability for the class disease and yl is the label for the lung class. The entire loss is then defined as
,
|
where ω1, ω2, and ω3 are the weights that define how much each of the components will participate in the final loss. For our experiments, we kept all the weights equal to one. The architecture is in Figure 2. For the training of AtlasNet, we used six different deep convolutional neural networks with a SegNet autoencoder architecture. After the training of the six deep convolutional neural networks, AtlasNet combined their predictions by using an ensemble strategy and applied a simple-majority voting principle.
Figure 2:
Architecture of the AtlasNet framework. ReLU = rectified linear unit.
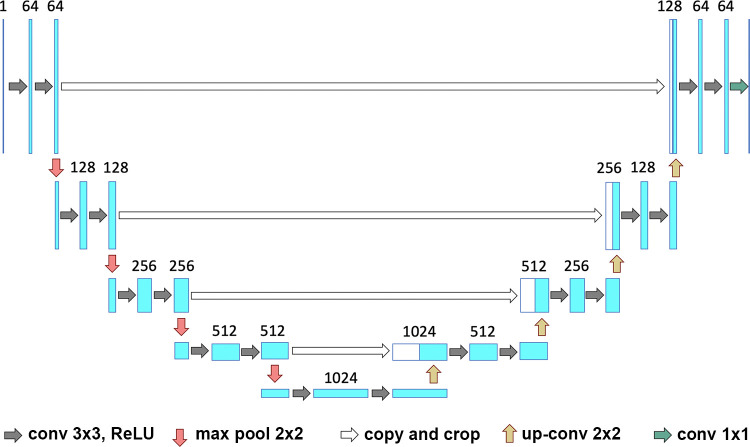
For comparison purposes, we also trained a U-Net (Department of Computer Science, University of Freiburg, Freiburg, Germany) (18) architecture on the same data (Fig 3). The same parameters for training all networks (initial learning rate = 0.01, decrease of learning rate = 2.5 × 10⁻³ every 10 epochs, momentum = 0.9, and weight decay = 5 × 10⁻⁴) were used. The training of a single network was completed in approximately 16 hours by using a graphics processing unit (GeForce GTX 1080; NVIDIA, Santa Clara, Calif), whereas the prediction for a single CT scan was completed in a few seconds. A total of 6888 images containing annotations for both lung and disease, each with a dimension of 512 × 512 pixels, were used for training (80%) and validation (20%). AtlasNet does not use any conventional data augmentation method. AtlasNet is based on the principle of mapping all training examples to several different templates through deformable registration, which can be seen as an anatomically plausible data-augmentation approach. To address the request for comparison, data augmentation was performed for the U-Net architecture, involving random rotations (between −10° and 10°) and translations (between 0 and 20 pixels per axis), but local deformations were not considered because generating anatomically consistent disease patterns is challenging.
Figure 3:
Visual representation of the U-Net framework. Conv = conversion, max pool = max pooling, ReLU = rectified linear unit.
The two developed algorithms (proposed AtlasNet and U-Net) were then applied to the test dataset, and ILD contours provided by the algorithm were compared with those from three independent radiologists. To assess the clinical relevance of the deep learning method, the correlation between disease extent (analysis of the whole CT) and the PFT measurements was evaluated in the remaining 171 patients from the database who underwent chest CT and PFTs within a 3-month interval (hereafter, referred to as the correlation-with-PFTs dataset). The correlation with PFT measurements was also evaluated in the external validation dataset. To calculate disease extent, the volume of the diseased lung was divided by the volume of the whole lung.
Statistical Analysis
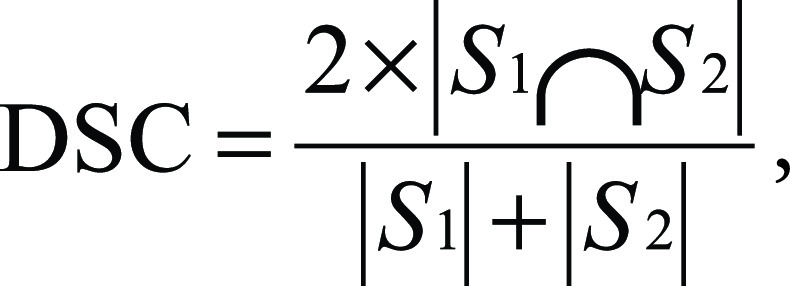
Statistical analysis and the development of the deep learning framework were performed with Python software (version 2.7; Python Software Foundation, Wilmington, Del) by using Scipy and Keras libraries. Patient characteristics were compared by using the Fisher exact test, the Kruskal-Wallis test, and the Mann-Whitney U test. The Dice similarity coefficient (DSC) was calculated in the test dataset to evaluate the agreement among radiologists’ contours and between each radiologist and the contours generated by the two different deep learning algorithms (AtlasNet and U-Net). The DSC is a statistic used to compare the similarity of two segmentations. It is commonly used in image segmentation, in particular for comparisons against reference masks in medical applications. It is calculated according to the following formula:
,
|
where S1 and S2 are the areas of the first and second segmentation, respectively (19). A DSC of 1 corresponds to a perfect match between two segmentations, whereas a DSC of 0 means no overlap. The Spearman rank correlation coefficient (ρ) was calculated to determine the correlation between the normalized volume of diseased lung and the pulmonary function parameters.
Results
Patient Characteristics
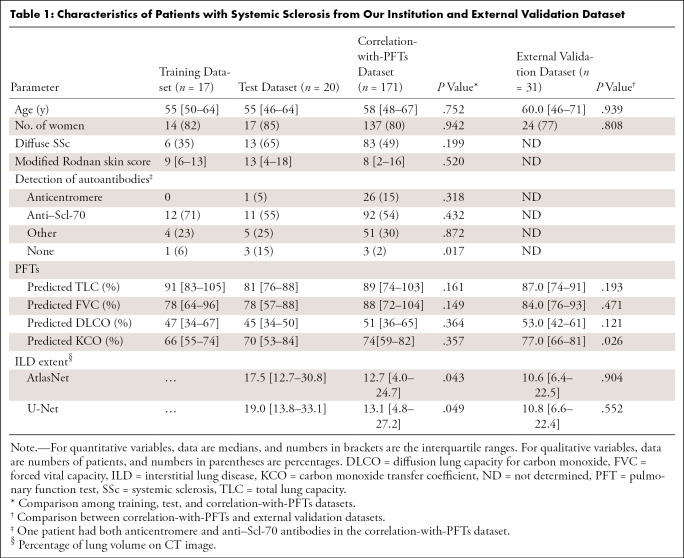
Images in 208 patients (median age, 57 years; interquartile range [IQR], 48–66 years; 167 women) from our institution were evaluated and split among a training and validation dataset (n = 17), test dataset (n = 20), and a correlation-with-PFTs dataset (n = 171) (Fig 1). There was no significant difference in patient characteristics among those from the training and validation, test, and correlation-with-PFTs datasets (P > .05; Table 1), except for a significantly lower proportion of patients without detectable autoantibodies (P = .017). There was also a slightly larger ILD extent in the test dataset (17.5% vs 12.7% with AtlasNet segmentation [P = .043] and 19.0% vs 13.1% with U-Net [P = .049]).
Table 1:
Characteristics of Patients with Systemic Sclerosis from Our Institution and External Validation Dataset
Patients from the correlation-with-PFTs dataset were mainly women (137 of 171; 80.1%), with a median age of 58 years (IQR, 48–67 years). The proportions of diffuse (83 of 171; 48.5%) and limited (88 of 171; 51.5%) SSc were similar. Most patients had positive anti–Scl-70 autoantibodies (92 of 171; 53.8%). The mean interval between CT and PFTs was 0 days (IQR, 0–0 days; range, 0–92 days). The median forced vital capacity was 88% of the predicted value (IQR, 72%–104%), and the median total lung capacity was 89% of the predicted value (IQR, 74%–103%). Pulmonary gas exchange was also impaired, with a median corrected-for-hemoglobin diffusion lung capacity for carbon monoxide of 51% of the predicted value (IQR, 36%–65%) and a median corrected-for-hemoglobin carbon monoxide transfer coefficient of 74% of the predicted value (IQR, 59%–82%).
Additionally, 31 patients from another institution were included in the external validation dataset. Patients from this dataset were mainly women (24 of 31; 77%) with a median age of 60 years (IQR, 46–71 years). Their clinical characteristics were not significantly different from those from the correlation-with-PFTs set (P > .05), except for a significantly higher carbon monoxide transfer coefficient (P = .026), but the disease extent was not different (P > .05) (Table 1).
Segmentation Comparisons
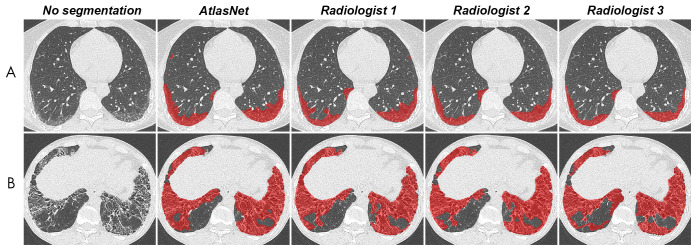
Regarding the intraobserver variation in the training dataset, the median DSC was 0.75 (IQR, 0.70–0.78). The median DSC between the readers’ assessment of the test dataset ranged from 0.68 to 0.71. By using AtlasNet, the median DSCs between the deep learning and manually outlined ILD extent for each radiologist (Fig 4) ranged from 0.74 (IQR, 0.65–0.77) to 0.75 (IQR, 0.63–0.79) (Table 2). DSCs between the U-Net and manually outlined ILD extent were lower, ranging from 0.71 (IQR, 0.61–0.77) to 0.72 (IQR, 0.63–0.78). For the lung segmentation, AtlasNet achieved a DSC of 0.985 (IQR, 0.966–0.989), compared with 0.974 (IQR, 0.968–0.979) for U-Net. Moreover, U-Net occasionally generated false disease detections in organs outside the lung, such as the stomach, which was not observed with AtlasNet. Two three-dimensional networks were used to evaluate whether the disease segmentation could be improved with a three-dimensional approach (Appendix E1 [supplement]). The performance was not improved (mean DSCs for the best model were 0.66 for the training dataset, 0.60 for the validation dataset, and 0.55 for the test dataset), which we explain by the fact that the proportion of diseased lung (1.29% of the whole CT volume) was too small for a three-dimensional approach.
Figure 4:
Comparison between automated and manual segmentations in, A, a 52-year-old woman with systemic sclerosis–related interstitial lung disease and, B, a 38-year-old man with systemic sclerosis–related interstitial lung disease. Contouring of these diseased areas was similar as performed by the algorithm and the three radiologists.
Table 2:
Median Dice Similarity Coefficients between Interstitial Lung Disease Contours in Test Dataset
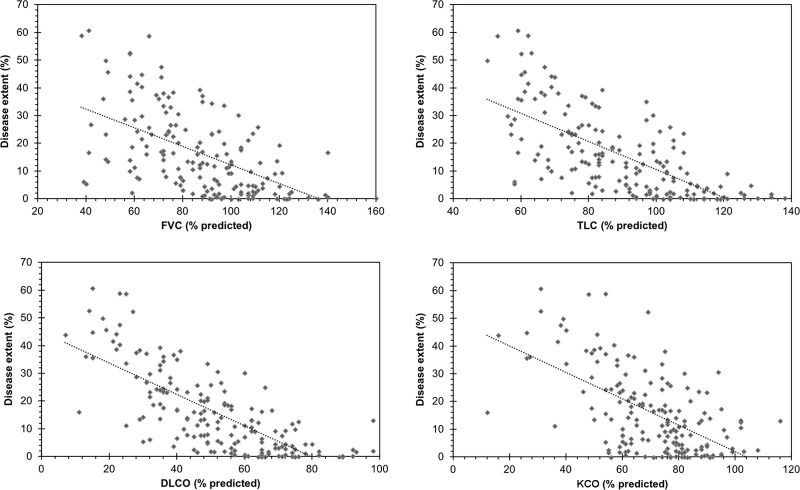
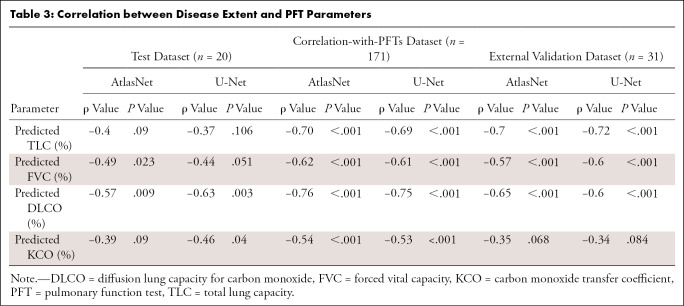
By using AtlasNet architecture, the median normalized volume of diseased lung in the correlation-with-PFTs dataset was 12.7% (IQR, 4.0%–24.7%). Among all PFT parameters, the highest correlation was obtained with diffusion lung capacity for carbon monoxide (ρ = −0.76; P < .001) (Fig 5). The computed disease extent also correlated well with total lung capacity (ρ = −0.70; P < .001), forced vital capacity (ρ = −0.62; P < .001), and the carbon monoxide transfer coefficient (ρ = −0.54; P < .001) (Table 3). Correlation with PFT results was in the same range when U-Net architecture was used (ρ = −0.75 for diffusion lung capacity for carbon monoxide, ρ = −0.69 for total lung capacity, ρ = −0.61 for forced vital capacity, and ρ = −0.53 for the carbon monoxide transfer coefficient; P < .001 for all).
Figure 5:
Relationship between systemic sclerosis–related interstitial lung disease extent measured by the algorithm and measurements from pulmonary function tests. DLCO = diffusion lung capacity for carbon monoxide, FVC = forced vital capacity, KCO = carbon monoxide transfer coefficient, TLC = total lung capacity.
Table 3:
Correlation between Disease Extent and PFT Parameters
In the external validation dataset, we observed similar correlation levels with total lung capacity and forced vital capacity (ρ = −0.70 to −0.72 and −0.57 to −0.60, respectively), whereas the correlation with diffusion lung capacity for carbon monoxide was weaker, especially for U-Net (ρ = −0.60) versus AtlasNet (ρ = −0.65; P < .001 for both).
Discussion
We reported a deep learning–based method to evaluate the extent of ILD in patients with SSc with results similar to those of radiologists. The advantage is that our method allows quantitative analysis of all CT images, which is in contrast to visual scoring. The ILD extent provided by our model with AtlasNet architecture was well correlated with PFT results, especially diffusion lung capacity for carbon monoxide.
Similar to Humphries et al (20), who studied idiopathic pulmonary fibrosis, we chose to focus our method on the assessment of the overall extent of ILD, rather than choosing a pattern-based approach. Indeed, the overall percentage of diseased lung has been reported to be a strong predictor of mortality in patients with SSc (6), without referring to the specific patterns. Moreover, individual signs of ILD such as reticulations and ground-glass opacities often overlap, and the interobserver agreement for the differentiation between bronchiectasis and honeycombing is only moderate (21).
To test the performance of our model, we first calculated the DSC variability among radiologists in the test dataset. Manual ILD contouring on chest CT scans can be time-consuming, and image segmentation is subject to interobserver variability (22). The DSC is the most common metric for validating medical volume segmentations (23). The median radiologists’ DSCs ranged from 0.68 to 0.71, which is similar to the results by O’Neil et al (22), who found DSCs of observers ranging from 0.41 to 0.77 for overall ILD segmentation but found lower DSC values for individual signs of ILD (22,23). It is noteworthy that there were fewer differences between the algorithm and each radiologist’s ILD contours than among radiologists’ contours in our study. AtlasNet performed better than U-Net, showing 3% absolute improvement on DSCs for the disease segmentation.
Other methods, such as patch-based approaches, have been evaluated for computer-aided ILD segmentation, with diverse results (24–26). Patch-based approaches exploit only local information, without accounting for the information contained in the whole CT slice, which we did with our deep convolutional neural network approach. Spatial localization is a key element of ILD analysis at CT, especially for the diagnosis of idiopathic pulmonary fibrosis (27,28). In SSc, ILD distribution is also a key feature and usually predominates in the subpleural aspects of the lower lobes (29,30).
The results of our deep learning algorithm showed good correlation with PFT parameters, higher than those previously reported for visual scores (ρ = −0.70 vs −0.38 to −0.39 for total lung capacity, ρ = −0.62 vs −0.39 to −0.43 for forced vital capacity, and ρ = −0.76 vs −0.39 to −0.50 for diffusion lung capacity for carbon monoxide) (6,29,31,32) as well as those obtained by Kim et al (24) by using a texture-based classifier for SSc ILD segmentation in the Scleroderma Lung Study I cohort (ρ = −0.32 for forced vital capacity, ρ = −0.34 for total lung capacity, and ρ = −0.35 for diffusion lung capacity for carbon monoxide). This group developed a texture-based classifier by using a local histogram analysis of small patches to classify each voxel into different lung patterns and a support-vector machine algorithm (33). By using this method, Tashkin et al (34) reported a weaker correlation between ILD extent at CT and diffusion lung capacity for carbon monoxide (ρ = −0.39) than that observed in our study. The same approach, based on textural analysis and the support-vector machine algorithm, has been used for the quantification of idiopathic pulmonary fibrosis (35). The correlations with forced vital capacity predicted percentage and with diffusion lung capacity for carbon monoxide predicted percentage ranged from −0.37 to −0.49 and from −0.57 to −0.68, respectively, which were weaker than the correlations obtained by our method. We tested the developed algorithm on an external dataset of 31 patients with scleroderma and found the correlation with pulmonary indexes to be in the same range for total lung capacity and forced vital capacity, and although the correlation with diffusion lung capacity for carbon monoxide was weaker, the correlations remained superior to those reported for visual scores.
A histogram-based approach has been proposed by Salaffi et al (36). Unlike the texture-based classifier (24), this method uses the histogram characteristics of the entire lung. In this semiautomated method, SSc ILD is quantified by isolating lung attenuation values between −200 and −700 HU. The correlations with the forced vital capacity (ρ = −0.56) and the diffusion lung capacity for carbon monoxide (ρ = −0.67) obtained in that study were close to those obtained in ours. However, because there is no anatomic characterization of the disease, any cause of increased lung attenuation, caused by infection, for example, may interfere with the quantification.
The strength of our study was that the algorithm was validated in comparison with radiologists’ findings, and its clinical relevance was evaluated in a large patient group from a reference center and confirmed with an external dataset. In addition, the training and testing phases were based on heterogeneous CT images. Because technical parameters are known to substantially influence imaging features, it was essential to train the algorithm with various CT parameters so that it would be applicable in any CT protocol (37,38).
Our study had limitations. We could not assess the repeatability of our deep learning algorithm when assessing disease extent on distinct but concomitant CT acquisitions. Indeed, patients from this retrospective dataset had no medical reason to undergo short-term repeated CT examinations. Another limitation was the use of annotations from only one observer for the training dataset. However, the DSCs between computed and manual outlines by three observers were similar, confirming that this did not bias our results.
In conclusion, we have developed a fully automatic, deep learning–based method that performs as well as radiologists for outlining ILD extent at chest CT of patients with SSc and has the advantage of being applicable to all acquired images. Thus, the total disease extent, which is a recognized powerful predictor of mortality, can be automatically quantified. We believe that this method can thus contribute to improved efficiency of patient care for patients with SSc, and future refinements will allow its use in various additional pulmonary diseases.
APPENDIX
SUPPLEMENTAL FIGURES
This study was part of a research cooperation between Ecole CentraleSupelec and Assistance Publique des Hôpitaux de Paris, Hôpital Cochin, which received partial financial support from General Electric Healthcare and the Fondation pour la Recherche Médicale. Sponsors were not involved in data acquisition, data analysis, or manuscript preparation.
Disclosures of Conflicts of Interest: G.C. disclosed no relevant relationships. M.V. disclosed no relevant relationships. A.R. disclosed no relevant relationships. E.I.Z. disclosed no relevant relationships. G.A. disclosed no relevant relationships. C.M. disclosed no relevant relationships. R.M. Activities related to the present article: disclosed no relevant relationships. Activities not related to the present article: disclosed money paid to author for employment from Therapanacea. Other relationships: disclosed no relevant relationships. N. Bus disclosed no relevant relationships. N.J. disclosed no relevant relationships. A.M. disclosed no relevant relationships. T.H.H. disclosed no relevant relationships. L.M.C. disclosed no relevant relationships. N. Benmostefa disclosed no relevant relationships. L.M. disclosed no relevant relationships. A.T.D.X. disclosed no relevant relationships. N.P. Activities related to the present article: disclosed no relevant relationships. Activities not related to the present article: disclosed money paid to author for consultancy from Safran, employment from Therapanacea, and royalties from Intrasense; disclosed patents issued from Ecole Centrale Supelec; patents licensed from Intrasence, Therapanacea, and Olea; and royalties from Intrasense, Therapanacea, and Olea. Other relationships: disclosed no relevant relationships. M.P.R. disclosed no relevant relationships.
Abbreviations:
- DSC
- Dice similarity coefficient
- ILD
- interstitial lung disease
- IQR
- interquartile range
- PFT
- pulmonary function test
- SSc
- systemic sclerosis
References
- 1.Chifflot H, Fautrel B, Sordet C, Chatelus E, Sibilia J. Incidence and prevalence of systemic sclerosis: a systematic literature review. Semin Arthritis Rheum 2008;37(4):223–235. [DOI] [PubMed] [Google Scholar]
- 2.LeRoy EC, Black C, Fleischmajer R, et al. Scleroderma (systemic sclerosis): classification, subsets and pathogenesis. J Rheumatol 1988;15(2):202–205. [PubMed] [Google Scholar]
- 3.Rubio-Rivas M, Royo C, Simeón CP, Corbella X, Fonollosa V. Mortality and survival in systemic sclerosis: systematic review and meta-analysis. Semin Arthritis Rheum 2014;44(2):208–219. [DOI] [PubMed] [Google Scholar]
- 4.Tyndall AJ, Bannert B, Vonk M, et al. Causes and risk factors for death in systemic sclerosis: a study from the EULAR Scleroderma Trials and Research (EUSTAR) database. Ann Rheum Dis 2010;69(10):1809–1815. [DOI] [PubMed] [Google Scholar]
- 5.Meier FMP, Frommer KW, Dinser R, et al. Update on the profile of the EUSTAR cohort: an analysis of the EULAR Scleroderma Trials and Research group database. Ann Rheum Dis 2012;71(8):1355–1360. [DOI] [PubMed] [Google Scholar]
- 6.Goh NSL, Desai SR, Veeraraghavan S, et al. Interstitial lung disease in systemic sclerosis: a simple staging system. Am J Respir Crit Care Med 2008;177(11):1248–1254. [DOI] [PubMed] [Google Scholar]
- 7.Moore OA, Goh N, Corte T, et al. Extent of disease on high-resolution computed tomography lung is a predictor of decline and mortality in systemic sclerosis-related interstitial lung disease. Rheumatology (Oxford) 2013;52(1):155–160. [DOI] [PubMed] [Google Scholar]
- 8.Wells AU. Interstitial lung disease in systemic sclerosis. Presse Med 2014;43(10 Pt 2):e329–e343. [DOI] [PubMed] [Google Scholar]
- 9.Collins CD, Wells AU, Hansell DM, et al. Observer variation in pattern type and extent of disease in fibrosing alveolitis on thin section computed tomography and chest radiography. Clin Radiol 1994;49(4):236–240. [DOI] [PubMed] [Google Scholar]
- 10.Sverzellati N, Devaraj A, Desai SR, Quigley M, Wells AU, Hansell DM. Method for minimizing observer variation for the quantitation of high-resolution computed tomographic signs of lung disease. J Comput Assist Tomogr 2011;35(5):596–601. [DOI] [PubMed] [Google Scholar]
- 11.McBee MP, Awan OA, Colucci AT, et al. Deep learning in radiology. Acad Radiol 2018;25(11):1472–1480. [DOI] [PubMed] [Google Scholar]
- 12.Litjens G, Kooi T, Bejnordi BE, et al. A survey on deep learning in medical image analysis. Med Image Anal 2017;42:60–88. [DOI] [PubMed] [Google Scholar]
- 13.Ker J, Wang L, Rao J, Lim T. Deep learning applications in medical image analysis. IEEE Access 2018;6:9375–9389. [Google Scholar]
- 14.Depeursinge A, Vargas A, Platon A, Geissbuhler A, Poletti PA, Müller H. Building a reference multimedia database for interstitial lung diseases. Comput Med Imaging Graph 2012;36(3):227–238. [DOI] [PubMed] [Google Scholar]
- 15.van den Hoogen F, Khanna D, Fransen J, et al. 2013 Classification criteria for systemic sclerosis: an American College of Rheumatology/European League against Rheumatism collaborative initiative. Arthritis Rheum 2013;65(11):2737–2747. [DOI] [PMC free article] [PubMed] [Google Scholar]
- 16.Vakalopoulou M, Chassagnon G, Bus N, et al. AtlasNet: multi-atlas non-linear deep networks for medical image segmentation. In: Frangi A, Schnabel J, Davatzikos C, Alberola-López C, Fichtinger G, eds. Medical image computing and computer assisted intervention – MICCAI 2018: 21st international conference, Granada, Spain, September 16–20, 2018, proceedings, part IV. Vol 11073, Lecture Notes in Computer Science. Cham, Switzerland: Springer, 2018; 658–666. [Google Scholar]
- 17.Badrinarayanan V, Kendall A, Cipolla R. SegNet: a deep convolutional encoder-decoder architecture for image segmentation. IEEE Trans Pattern Anal Mach Intell 2017;39(12):2481–2495. [DOI] [PubMed] [Google Scholar]
- 18.Ronneberger O, Fischer P, Brox T. U-Net: convolutional networks for biomedical image segmentation. ArXiv 150504597 cs [preprint] http://arxiv.org/abs/1505.04597. Posted May 18, 2015. Accessed February 10, 2019.
- 19.Dice LR. Measures of the amount of ecologic association between species. Ecology 1945;26(3):297–302. [Google Scholar]
- 20.Humphries SM, Yagihashi K, Huckleberry J, et al. Idiopathic pulmonary fibrosis: data-driven textural analysis of extent of fibrosis at baseline and 15-month follow-up. Radiology 2017;285(1):270–278. [DOI] [PMC free article] [PubMed] [Google Scholar]
- 21.Watadani T, Sakai F, Johkoh T, et al. Interobserver variability in the CT assessment of honeycombing in the lungs. Radiology 2013;266(3):936–944. [DOI] [PubMed] [Google Scholar]
- 22.O’Neil AQ, Murchison JT, van Beek EJR, Goatman KA. Crowdsourcing labels for pathological patterns in CT lung scans: can non-experts contribute expert-quality ground truth? In: Cardoso MJ, Arbel T, Lee SL, et al., eds. Intravascular imaging and computer assisted stenting, and large-scale annotation of biomedical data and expert label synthesis: 6th joint international workshops, CVII-STENT 2017 and second international workshop, LABELS 2017, held in conjunction with MICCAI 2017, Québec City, QC, Canada, September 10–14, 2017, proceedings. Vol 10552, Lecture Notes in Computer Science. Cham, Switzerland: Springer, 2017; 96–105. [Google Scholar]
- 23.Taha AA, Hanbury A. Metrics for evaluating 3D medical image segmentation: analysis, selection, and tool. BMC Med Imaging 2015;15(1):29. [DOI] [PMC free article] [PubMed] [Google Scholar]
- 24.Kim HG, Tashkin DP, Clements PJ, et al. A computer-aided diagnosis system for quantitative scoring of extent of lung fibrosis in scleroderma patients. Clin Exp Rheumatol 2010;28(5 Suppl 62):S26–S35. [PMC free article] [PubMed] [Google Scholar]
- 25.Depeursinge A, Van de Ville D, Platon A, Geissbuhler A, Poletti PA, Müller H. Near-affine-invariant texture learning for lung tissue analysis using isotropic wavelet frames. IEEE Trans Inf Technol Biomed 2012;16(4):665–675. [DOI] [PubMed] [Google Scholar]
- 26.Song Y, Cai W, Zhou Y, Feng DD. Feature-based image patch approximation for lung tissue classification. IEEE Trans Med Imaging 2013;32(4):797–808. [DOI] [PubMed] [Google Scholar]
- 27.Raghu G, Collard HR, Egan JJ, et al. An official ATS/ERS/JRS/ALAT statement: idiopathic pulmonary fibrosis: evidence-based guidelines for diagnosis and management. Am J Respir Crit Care Med 2011;183(6):788–824. [DOI] [PMC free article] [PubMed] [Google Scholar]
- 28.Lynch DA, Sverzellati N, Travis WD, et al. Diagnostic criteria for idiopathic pulmonary fibrosis: a Fleischner Society white paper. Lancet Respir Med 2018;6(2):138–153. [DOI] [PubMed] [Google Scholar]
- 29.Ooi GC, Mok MY, Tsang KWT, et al. Interstitial lung disease in systemic sclerosis. Acta Radiol 2003;44(3):258–264. [DOI] [PubMed] [Google Scholar]
- 30.Goldin JG, Lynch DA, Strollo DC, et al. High-resolution CT scan findings in patients with symptomatic scleroderma-related interstitial lung disease. Chest 2008;134(2):358–367. [DOI] [PubMed] [Google Scholar]
- 31.Diot E, Boissinot E, Asquier E, et al. Relationship between abnormalities on high-resolution CT and pulmonary function in systemic sclerosis. Chest 1998;114(6):1623–1629. [DOI] [PubMed] [Google Scholar]
- 32.Camiciottoli G, Orlandi I, Bartolucci M, et al. Lung CT densitometry in systemic sclerosis: correlation with lung function, exercise testing, and quality of life. Chest 2007;131(3):672–681. [DOI] [PubMed] [Google Scholar]
- 33.Cortes C, Vapnik V. Support-vector networks. Mach Learn 1995;20:273–297. [Google Scholar]
- 34.Tashkin DP, Volkmann ER, Tseng CH, et al. Relationship between quantitative radiographic assessments of interstitial lung disease and physiological and clinical features of systemic sclerosis. Ann Rheum Dis 2016;75(2):374–381. [DOI] [PubMed] [Google Scholar]
- 35.Humphries SM, Swigris JJ, Brown KK, et al. Quantitative high-resolution computed tomography fibrosis score: performance characteristics in idiopathic pulmonary fibrosis. Eur Respir J 2018;52(3):1801384. [DOI] [PubMed] [Google Scholar]
- 36.Salaffi F, Carotti M, Di Donato E, Di Carlo M, Ceccarelli L, Giuseppetti G. Computer-aided tomographic analysis of interstitial lung disease (ILD) in patients with systemic sclerosis (SSc). Correlation with pulmonary physiologic tests and patient-centred measures of perceived dyspnea and functional disability. PLoS One 2016;11(3):e0149240. [DOI] [PMC free article] [PubMed] [Google Scholar]
- 37.Gierada DS, Bierhals AJ, Choong CK, et al. Effects of CT section thickness and reconstruction kernel on emphysema quantification relationship to the magnitude of the CT emphysema index. Acad Radiol 2010;17(2):146–156. [DOI] [PMC free article] [PubMed] [Google Scholar]
- 38.Lu L, Ehmke RC, Schwartz LH, Zhao B. assessing agreement between radiomic features computed for multiple CT imaging settings. PLoS One 2016;11(12):e0166550. [DOI] [PMC free article] [PubMed] [Google Scholar]
Associated Data
This section collects any data citations, data availability statements, or supplementary materials included in this article.


