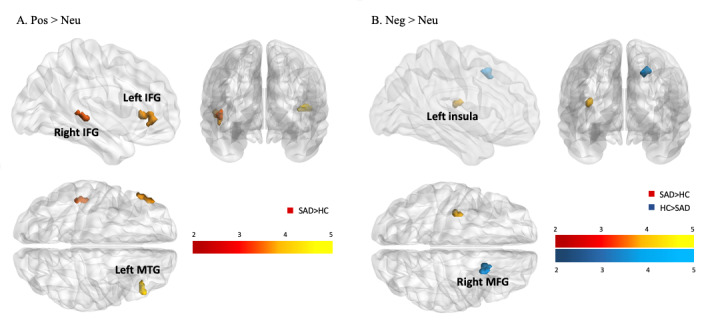
Figure 1.

(A) Statistical parametric map showing activation differences between the social anxiety disorder and control groups during positive self-referential processing. (B) Statistical parametric map showing activations associated with negative self-referential processing. HC: healthy control; IFG: inferior frontal gyrus; MFG: middle frontal gyrus; MTG: middle temporal gyrus; Neg: negative words; Neu: neutral words; Pos: positive words; SAD: social anxiety disorder. The color bar depicts Z values.
