. 2020 Jul 1;2(4):e190195. doi: 10.1148/ryai.2020190195

Figure 1:

Illustration of the manufacturer shift problem. The upper row shows the performance of U-Net 1 tested on datasets from manufacturer 1, and the lower row shows the performance of U-Net 1 tested on datasets from manufacturer 2. A performance drop can be observed, in the form of undersegmentation. Numbers at upper right corner of each subfigure indicate different examples. Green regions denote the automatic myocardium segmentation results by the U-Net, while red regions denote the blood pool segmentation results.

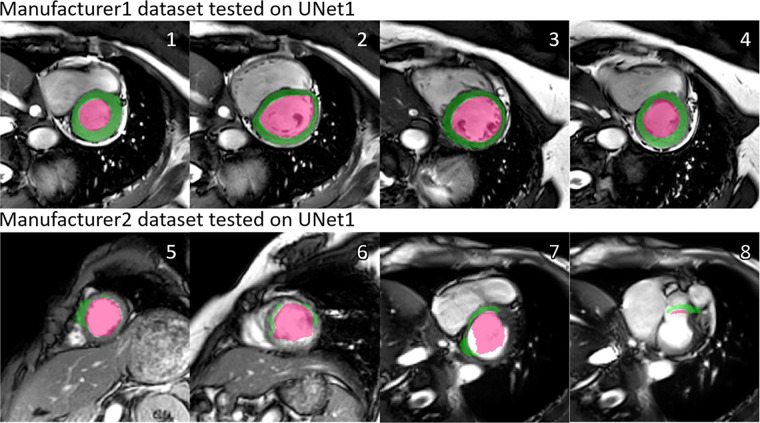
Illustration of the manufacturer shift problem. The upper row shows the performance of U-Net 1 tested on datasets from manufacturer 1, and the lower row shows the performance of U-Net 1 tested on datasets from manufacturer 2. A performance drop can be observed, in the form of undersegmentation. Numbers at upper right corner of each subfigure indicate different examples. Green regions denote the automatic myocardium segmentation results by the U-Net, while red regions denote the blood pool segmentation results.