. 2020 Jul 1;2(4):e190195. doi: 10.1148/ryai.2020190195

Figure 3:

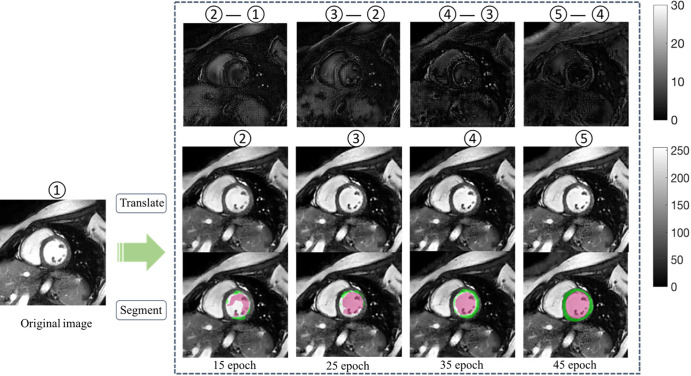
The performance of U-Net trained on one manufacturer dataset improved on dataset from another manufacturer, along with training epochs. Middle row shows adapted images at different epochs. Bottom row shows the corresponding segmentation results after manufacturer adaptation using the same U-Net. Upper row illustrates the subtle difference between the adapted images (scale indicated by gray-scale bar). Numbers 1–5 mark image at different adaptation stages, with 5 being the final adapted image. Green regions denote the automatic myocardium segmentation results by the U-Net, while red regions denote the blood pool segmentation results.

The performance of U-Net trained on one manufacturer dataset improved on dataset from another manufacturer, along with training epochs. Middle row shows adapted images at different epochs. Bottom row shows the corresponding segmentation results after manufacturer adaptation using the same U-Net. Upper row illustrates the subtle difference between the adapted images (scale indicated by gray-scale bar). Numbers 1–5 mark image at different adaptation stages, with 5 being the final adapted image. Green regions denote the automatic myocardium segmentation results by the U-Net, while red regions denote the blood pool segmentation results.