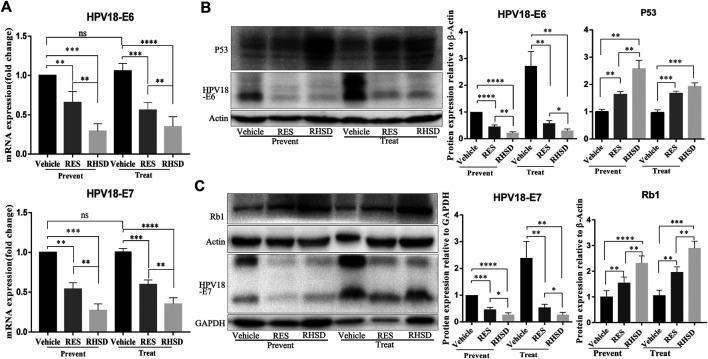
FIGURE 6.
Expression of HPV18 E6, E7, P53, and Rb1 in cervical cancer tissues of mice model after RES or RHSD treatment (A) HPV18 E6 and E7 mRNA levels in cancer tissues were determined using real-time RT-PCR (B) HPV18 E6 and P53 protein levels in cancer tissues were determined by Western blot. The histogram on the right is the quantitative analysis of the results (C) HPV18 E7 and Rb1 protein levels in cancer tissues were determined by Western blot. The histogram on the right is the quantitative analysis of the results. The data were presented as the mean ± S.D. for three different experiments performed in triplicate. **p < 0.01, ***p < 0.001, and ****p < 0.0001.

