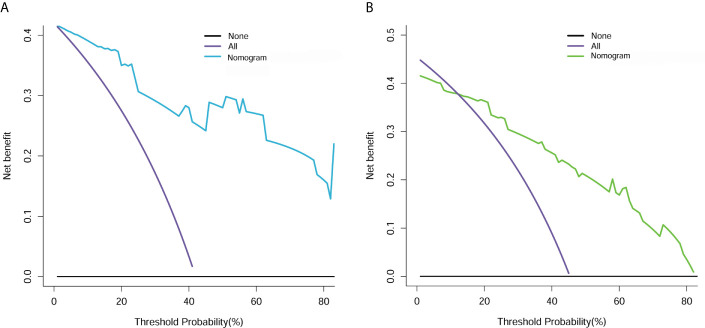
Figure 7.
Decision curve analysis for clin-radiomics combined model in the primary (A) and validation (B) cohorts. The Y axis measures the net benefit. The blue (primary cohort) and green (validation cohort) lines represent the clin-radiomics combined model. The purple line represents the assumption that the postoperative CEE is highly expressed in all patients. The black line represents the assumption that no patients had a postoperative CEE.

